Table of Contents for
OpenLayers 3.x Cookbook - Second Edition
 OpenLayers 3.x Cookbook - Second Edition
Published by
Packt Publishing, 2016
OpenLayers 3.x Cookbook - Second Edition
Published by
Packt Publishing, 2016
- Cover
- Table of Contents
- OpenLayers 3.x Cookbook Second Edition
- OpenLayers 3.x Cookbook Second Edition
- Credits
- About the Authors
- About the Reviewer
- www.PacktPub.com
- Preface
- What you need for this book
- Who this book is for
- Sections
- Conventions
- Reader feedback
- Customer support
- 1. Web Mapping Basics
- Creating a simple fullscreen map
- Playing with the map's options
- Managing the map's stack layers
- Managing the map's controls
- Moving around the map view
- Restricting the map's extent
- 2. Adding Raster Layers
- Using Bing imagery
- Using OpenStreetMap imagery
- Adding WMS layers
- Changing the zoom effect
- Changing layer opacity
- Buffering the layer data to improve map navigation
- Creating an image layer
- Setting the tile size in WMS layers
- 3. Working with Vector Layers
- Adding a GML layer
- Adding a KML layer
- Creating features programmatically
- Exporting features as GeoJSON
- Reading and creating features from a WKT
- Using point features as markers
- Removing or cloning features using overlays
- Zooming to the extent of a layer
- Adding text labels to geometry points
- Adding features from a WFS server
- Using the cluster strategy
- Reading features directly using AJAX
- Creating a heat map
- 4. Working with Events
- Creating a side-by-side map comparator
- Implementing a work-in-progress indicator for map layers
- Listening for the vector layer features' events
- Listening for mouse or touch events
- Using the keyboard to pan or zoom
- 5. Adding Controls
- Adding and removing controls
- Working with geolocation
- Placing controls outside the map
- Drawing features across multiple vector layers
- Modifying features
- Measuring distances and areas
- Getting feature information from a data source
- Getting information from a WMS server
- 6. Styling Features
- Styling layers
- Styling features based on geometry type
- Styling based on feature attributes
- Styling interaction render intents
- Styling clustered features
- 7. Beyond the Basics
- Working with projections
- Creating a custom control
- Selecting features by dragging out a selection area
- Transitioning between weather forecast imagery
- Using the custom OpenLayers library build
- Drawing in freehand mode
- Modifying layer appearance
- Adding features to the vector layer by dragging and dropping them
- Making use of map permalinks
- Index
Setting a custom tile size for a WMS layer in OpenLayers 3 is a bit more involved than with OpenLayers 2. It requires the use of the ol.tilegrid.TileGrid class. This class provides some flexible control over the grid pattern that is used for sources accessing tiled image servers.
Of course, controlling the tile size of the WMS request can affect the performance. By default, the tile size is 256 x 256 pixels, but we can set this to something different. Bigger tile sizes mean fewer requests to the server but more computation time to generate a bigger image and a larger download size per image. On the contrary, smaller tile sizes mean more server requests and less time to compute smaller images. If you use the default tile sizes, then it's more likely the images will have already been cached, so it may increase performance.
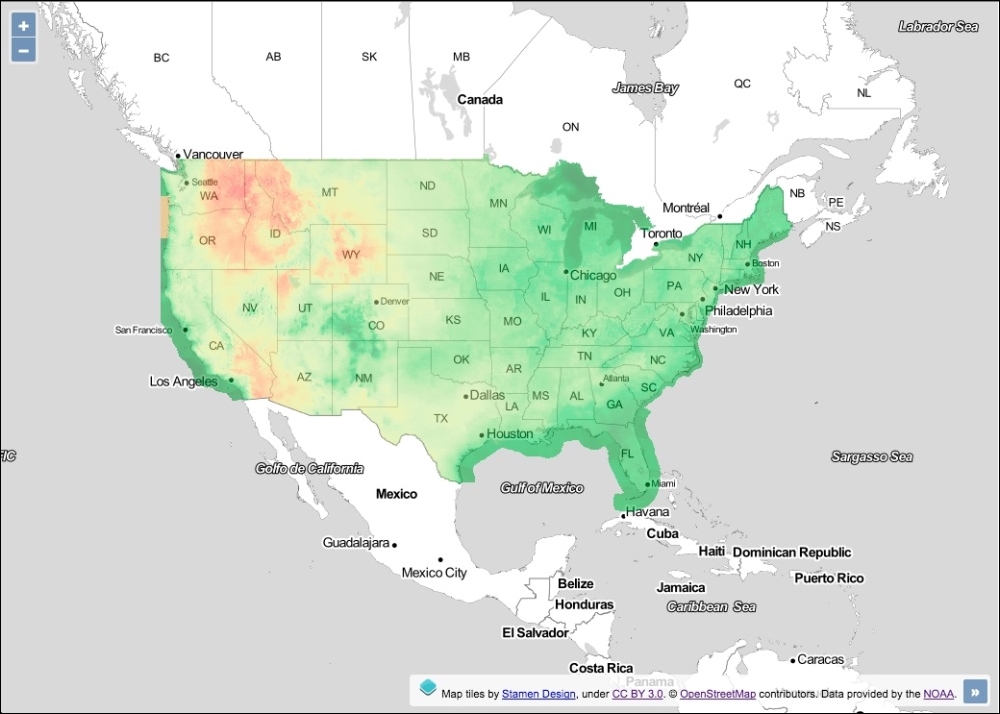
In any case, it's good to know how we can make these adjustments. The source code can be found in ch02/ch02-tile-size/. Here's what we'll end up with:
To set the tile size for our WMS layer requests, perform the following steps:
- Create an HTML file with OpenLayers dependencies and a
divfor the map container. - Create a custom JavaScript file and initialize the map with a background layer from the Stamen collection:
var map = new ol.Map({ view: new ol.View({ zoom: 0, maxZoom: 8, center: [-10439500, 4256000] }), target: 'js-map', layers: [ new ol.layer.Tile({ source: new ol.source.Stamen({ layer: 'toner-lite' }) }) ] }); - Cache
viewinto a variable for reuse and build up the resolutions for our customized WMS layer:var view = map.getView(); var resolutions = [view.getResolution()]; for (var i = 1; i < 8; i++) { resolutions.push(resolutions[0] / Math.pow(2, i)); } - Adjust the zoom level for the
viewand create the custom tile grid layer:view.setZoom(4); var tileGrid = new ol.tilegrid.TileGrid({ extent: view.getProjection().getExtent(), resolutions: resolutions, tileSize: [512, 512] }); - Finally, create the tile layer, apply the custom tile grid to the layer source, and add the layer to the map:
map.addLayer(new ol.layer.Tile({
  source: new ol.source.TileWMS({
    url: 'http://gis.srh.noaa.gov/arcgis/services/' +
         'NDFDTemps/MapServer/WMSServer',
    params: {
      LAYERS: 16
    },
    attributions: [
      new ol.Attribution({
        html: 'Data provided by the ' +
              '<a href="http://noaa.gov">NOAA</a>.'
      })
    ],
    tileGrid: tileGrid
  }),
  opacity: 0.50
}));
We've used a WMS layer from NOAA that provides temperature data across the USA. To provide some context for this data the background mapping is from the Stamen source provider using a layer called toner-lite. For the remainder of this section, let's focus on the code that primarily influences the custom tile size:
var resolutions = [view.getResolution()];
for (var i = 1; i < 8; i++) {
  resolutions.push(resolutions[0] / Math.pow(2, i));
}
We build up a custom list of resolutions for the WMS layer. The array is stored inside of the variable named resolutions. We've preloaded this array at index 0 with the initial resolution of the view via the getResolution method on the view instance. As we instantiated the view with a zoom level of 0, this initial view resolution is equal to the minimum resolution available.
We use a for loop in order to populate our custom list of resolutions. New resolutions are added into the array from index 1 (var i = 1), as index 0 already contains the minimum resolution. We've arbitrarily decided to add an additional seven resolutions only (i < 8). The imagery returned from the WMS service doesn't add much value beyond this resolution, so restricting it to a zoom level of 8 felt appropriate.
As we iterate through the for loop, we calculate what the next resolution should be. To break this logic down, let's come up with a contrived example: say the minimum resolution began at 20. To get the next resolution, we divide this by the zoom factor of 2 (which is the default zoom factor for ol.View). This results in 10. To get the next resolution level, we again divide 10 by 2, resulting in 5, and so on (for another 5 more times).
A concise way to accomplish this result is through exponentiation. The starting (minimum) resolution becomes the constant value during calculation, which is divided by the result of 2 (the zoom factor) multiplied by the iteration value. To demonstrate this, we'll continue with our example from earlier: 20 / (2 x 1) = 10, then 20 / (2 x 2) = 5, and so on.
The minimum resolution is always at index 0 (resolutions[0]) of the array, so as we iterate through the loop we use the JavaScript Math.pow method (does exponentiation) to calculate the next resolution (explained previously), then we push it onto the resolutions array.
var tileGrid = new ol.tilegrid.TileGrid({
  extent: view.getProjection().getExtent(),
  resolutions: resolutions,
  tileSize: [512, 512]
});
We store our instance of ol.tilegrid.TileGrid into a variable, namely tileGrid. The first property that we set is the extent.
In order to get an appropriate extent, we first retrieve the projection object being used by the view with the getProjection method. This method returns the projection object of type ol.proj.Projection. The default projection the view initializes with is EPSG:3857. As default, OpenLayers includes the projection objects for EPSG:3857 and EPSG:4326.
The ol.proj.Projection object contains some useful utility methods when working with projections, one of which is getExtent. This method returns the full extent of the projection that we use for our custom grid layer.
The resolutions property is provided with our custom array of resolutions created from earlier.
The tileSize property expects an ol.Size type array, which is simply a pair of numbers representing a size: width, then height. We chose to double the default tile size from 256 x 256 to 512 x 512 pixels.
This completes our custom grid configuration, which we later add to the ol.source.TileWMS settings via the tileGrid property.
The ol.tilegrid.TileGrid class allows you to set a custom set of resolutions (as we've seen) but also match different tile sizes against particular resolutions. Instead of using the tileSize property, you use the plural tileSizes property and pass in an array of tile sizes. The total number of items in the tileSizes array should match the length of the resolutions array. For example, the first resolution in the resolutions array would use the first tile size dimensions in the tileSizes array.