Table of Contents for
OpenLayers 3.x Cookbook - Second Edition
 OpenLayers 3.x Cookbook - Second Edition
Published by
Packt Publishing, 2016
OpenLayers 3.x Cookbook - Second Edition
Published by
Packt Publishing, 2016
- Cover
- Table of Contents
- OpenLayers 3.x Cookbook Second Edition
- OpenLayers 3.x Cookbook Second Edition
- Credits
- About the Authors
- About the Reviewer
- www.PacktPub.com
- Preface
- What you need for this book
- Who this book is for
- Sections
- Conventions
- Reader feedback
- Customer support
- 1. Web Mapping Basics
- Creating a simple fullscreen map
- Playing with the map's options
- Managing the map's stack layers
- Managing the map's controls
- Moving around the map view
- Restricting the map's extent
- 2. Adding Raster Layers
- Using Bing imagery
- Using OpenStreetMap imagery
- Adding WMS layers
- Changing the zoom effect
- Changing layer opacity
- Buffering the layer data to improve map navigation
- Creating an image layer
- Setting the tile size in WMS layers
- 3. Working with Vector Layers
- Adding a GML layer
- Adding a KML layer
- Creating features programmatically
- Exporting features as GeoJSON
- Reading and creating features from a WKT
- Using point features as markers
- Removing or cloning features using overlays
- Zooming to the extent of a layer
- Adding text labels to geometry points
- Adding features from a WFS server
- Using the cluster strategy
- Reading features directly using AJAX
- Creating a heat map
- 4. Working with Events
- Creating a side-by-side map comparator
- Implementing a work-in-progress indicator for map layers
- Listening for the vector layer features' events
- Listening for mouse or touch events
- Using the keyboard to pan or zoom
- 5. Adding Controls
- Adding and removing controls
- Working with geolocation
- Placing controls outside the map
- Drawing features across multiple vector layers
- Modifying features
- Measuring distances and areas
- Getting feature information from a data source
- Getting information from a WMS server
- 6. Styling Features
- Styling layers
- Styling features based on geometry type
- Styling based on feature attributes
- Styling interaction render intents
- Styling clustered features
- 7. Beyond the Basics
- Working with projections
- Creating a custom control
- Selecting features by dragging out a selection area
- Transitioning between weather forecast imagery
- Using the custom OpenLayers library build
- Drawing in freehand mode
- Modifying layer appearance
- Adding features to the vector layer by dragging and dropping them
- Making use of map permalinks
- Index
When you are working with many layers, both raster and vector layers, you will probably find situations where a layer that is on top of another layer obscures the one below it. This is more common when working with raster WMS layers without the transparent property set to true or tiled layers, such as OpenStreetMaps, and Bing Maps.
In this recipe, we'll create a slider that updates the layer opacity of the topmost layer, revealing a layer underneath as the opacity is lowered. The source code can be found in ch02/ch02-layer-opacity/. Here's a screenshot showing the layer opacity at 60%:
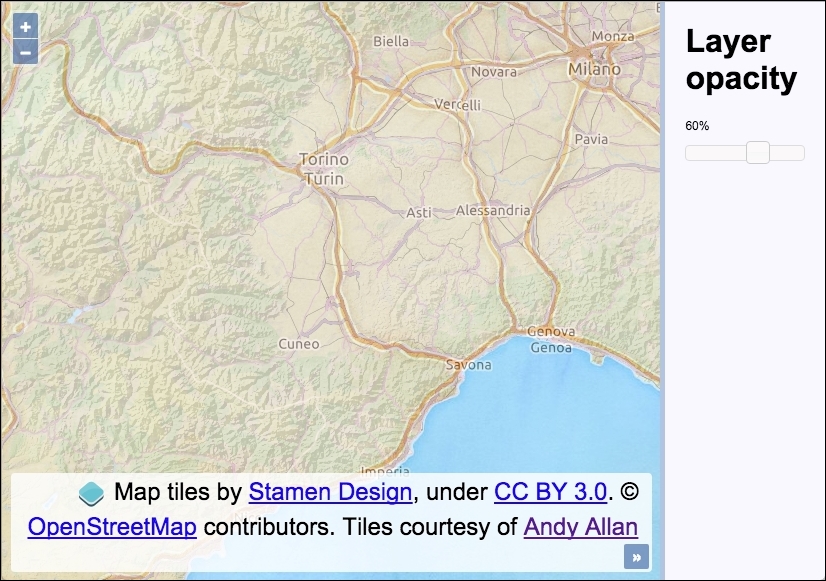
We used jQuery UI to create the slider widget. Here are the steps to create this recipe:
- Create an HTML file adding the required OpenLayers dependencies, as well as jQuery UI and dependencies. In particular, here's the markup for the map and opacity panels:
<div id="js-map" class="map"></div>
<div class="pane">
  <h1>Layer opacity</h1>
  <p id="js-opacity">100%</p>
  <div id="js-slider"></div>
</div>
- Next, create a
mapinstance with the Stamen watercolor tile layer and the landscape WMS layer from Andy Allan:var map = new ol.Map({ view: new ol.View({ zoom: 8, center: [860000, 5558000] }), target: 'js-map', layers: [ new ol.layer.Tile({ source: new ol.source.Stamen({ layer: 'watercolor' }) }), new ol.layer.Tile({ source: new ol.source.OSM({ attributions: [ new ol.Attribution({ html: 'Tiles courtesy of ' + '<a href="http://www.thunderforest.com">' + 'Andy Allan</a>' }), ol.source.OSM.ATTRIBUTION ], url: 'http://{a-c}.tile.thunderforest.com/' + 'landscape/{z}/{x}/{y}.png' }) }) ] }); - Cache the DOM element that reflects the opacity percentage:
var $opacity = $('#js-opacity'); - Finally, create the jQuery UI slider widget and update the layer opacity and percentage display on the slide:
$('#js-slider').slider({
  min: 0,
  max: 100,
  value: 100,
  slide: function(event, ui) {
    $opacity.text(ui.value + '%');
    map.getLayers().item(1).setOpacity(ui.value / 100);
  }
});
For the purpose of this recipe, let's focus in on the instantiation of the jQuery UI slider and how the map layer opacity is subsequently updated:
$('#js-slider').slider({
  min: 0,
  max: 100,
  value: 100,
Using jQuery, we target the DOM element that we want to convert into the slider widget. On the returned jQuery object, we attach the jQuery UI slider method with some configuration properties, which will create the slider widget as desired. The properties set an initial value of 100 to match the initial state of the map layer opacity, as well as a min and max value.
slide: function(event, ui) {
  $opacity.text(ui.value + '%');
  map.getLayers().item(1).setOpacity(ui.value / 100);
}
The slide property enables us to attach an event handler, which is called whenever the slider position updates. When this event fires, we have access to the event object and also the ui object from the jQuery UI. The ui object contains the new value from the slide action, and we update the text value of the DOM element to inform the user of the new opacity percentage.
We then fetch all the layers from the map using the map getLayers method, returning an ol.Collection object. This object provides us with some useful methods, such as item, which takes the index of an array item. We use this to get the second layer of the map.
The item method returns the second layer from the collection. This layer (an instance of ol.layer.Base), also contains many methods, one of which is setOpacity. We take the latest slider value (between 0 and 100) and convert it into the expected format for the setOpacity method (it must be between 0 and 1). This is achieved by dividing the value from the slider by 100. If the slider value is 60%, then 60 / 100 = 0.6. This change takes immediate effect, and you'll see the layer transparency update accordingly.
Layer opacity changes will fire an event called change:opacity. This is one of many layer events that you can subscribe to.