Table of Contents for
OpenLayers 3.x Cookbook - Second Edition
 OpenLayers 3.x Cookbook - Second Edition
Published by
Packt Publishing, 2016
OpenLayers 3.x Cookbook - Second Edition
Published by
Packt Publishing, 2016
- Cover
- Table of Contents
- OpenLayers 3.x Cookbook Second Edition
- OpenLayers 3.x Cookbook Second Edition
- Credits
- About the Authors
- About the Reviewer
- www.PacktPub.com
- Preface
- What you need for this book
- Who this book is for
- Sections
- Conventions
- Reader feedback
- Customer support
- 1. Web Mapping Basics
- Creating a simple fullscreen map
- Playing with the map's options
- Managing the map's stack layers
- Managing the map's controls
- Moving around the map view
- Restricting the map's extent
- 2. Adding Raster Layers
- Using Bing imagery
- Using OpenStreetMap imagery
- Adding WMS layers
- Changing the zoom effect
- Changing layer opacity
- Buffering the layer data to improve map navigation
- Creating an image layer
- Setting the tile size in WMS layers
- 3. Working with Vector Layers
- Adding a GML layer
- Adding a KML layer
- Creating features programmatically
- Exporting features as GeoJSON
- Reading and creating features from a WKT
- Using point features as markers
- Removing or cloning features using overlays
- Zooming to the extent of a layer
- Adding text labels to geometry points
- Adding features from a WFS server
- Using the cluster strategy
- Reading features directly using AJAX
- Creating a heat map
- 4. Working with Events
- Creating a side-by-side map comparator
- Implementing a work-in-progress indicator for map layers
- Listening for the vector layer features' events
- Listening for mouse or touch events
- Using the keyboard to pan or zoom
- 5. Adding Controls
- Adding and removing controls
- Working with geolocation
- Placing controls outside the map
- Drawing features across multiple vector layers
- Modifying features
- Measuring distances and areas
- Getting feature information from a data source
- Getting information from a WMS server
- 6. Styling Features
- Styling layers
- Styling features based on geometry type
- Styling based on feature attributes
- Styling interaction render intents
- Styling clustered features
- 7. Beyond the Basics
- Working with projections
- Creating a custom control
- Selecting features by dragging out a selection area
- Transitioning between weather forecast imagery
- Using the custom OpenLayers library build
- Drawing in freehand mode
- Modifying layer appearance
- Adding features to the vector layer by dragging and dropping them
- Making use of map permalinks
- Index
When working with lots of feature points, it is common to use the cluster strategy to avoid the overlapping of points and improve the rendering performance. We've previously covered the clustering strategy in detail in the Using the cluster strategy recipe in Chapter 3, Working with Vector Layers, and although we introduced some custom styling in that recipe, we'll look at some more styling options to enhance the appearance of the clusters in this recipe.
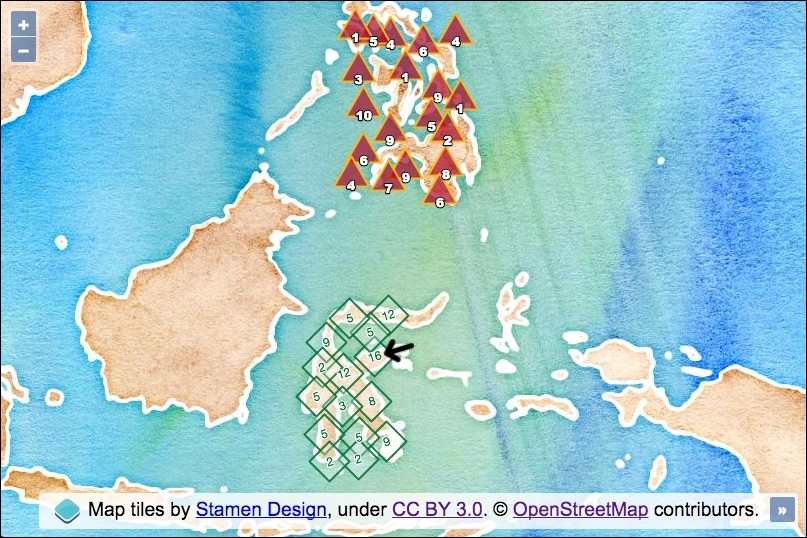
We are going to load two separate GeoJSON files containing around 100 point geometries, each within a concentrated area, displaying the benefits of what a clustering strategy provides to this type of data. We will render these two sets of features on different layers, each layer with a unique style.
As an added extra, for one of the vector layers, we are going to include an icon of an arrow that points to a cluster with a high amount of points beneath it. You can see what we mean by viewing the following screenshot.
The source code can be found in ch06/ch06-styling-clustered-features, and here's what it'll look like (as you can see, clustering can be completely transformed into a style that best matches your application):
In order to create uniquely-styled clustering that can complement your own particular map application, follow these steps:
- Create an HTML file with OpenLayers dependencies and a
divelement to hold the map. - Within a custom JavaScript file, instantiate an instance of
ol.Map:var map = new ol.Map({ view: new ol.View({ zoom: 5, center: [13565432, -577252] }), target: 'js-map', layers: [ new ol.layer.Tile({ source: new ol.source.Stamen({layer: 'watercolor'}) }) ] }); - Create the first vector layer style function, as follows:
var style1 = function(feature) { var length = feature.get('features').length; var styles = [ new ol.style.Style({ image: new ol.style.RegularShape({ radius: 20, points: 4, stroke: new ol.style.Stroke({ color: [1, 115, 54, 0.9], width: 2 }), fill: new ol.style.Fill({ color: [255, 255, 255, 0.3] }) }), text: new ol.style.Text({ text: length.toString(), rotation: -0.3, font: '12px "Helvetica Neue", Arial', fill: new ol.style.Fill({ color: [1, 115, 54, 1] }), stroke: new ol.style.Stroke({ color: [255, 255, 255, 1], width: 2 }) }) }) ]; if (length > 15) { styles.push(new ol.style.Style({ image: new ol.style.Icon({ src: '../../assets/images/arrow-left.png', rotation: -0.3, scale: 1.2, anchor: [-0.2, 0.5] }) })) } return styles; }; - Create the second vector layer style function:
var style2 = function(feature) { var length = feature.get('features').length; return [ new ol.style.Style({ image: new ol.style.RegularShape({ radius: 20, points: 3, stroke: new ol.style.Stroke({ color: [255, 188, 17, 0.9], width: 2 }), fill: new ol.style.Fill({ color: [173, 10, 43, 0.7] }) }), text: new ol.style.Text({ text: length.toString(), offsetY: 9, font: '12px "Arial Black"', fill: new ol.style.Fill({ color: 'white' }), stroke: new ol.style.Stroke({ color: [0, 0, 0, 1], width: 3 }) }) }) ]; }; - Set up a method that can instantiate a new clustered vector layer:
var createClusteredLayer = function(url, style) { return new ol.layer.Vector({ source: new ol.source.Cluster({ distance: 25, projection: 'EPSG:3857', source: new ol.source.Vector({ url: url, format: new ol.format.GeoJSON({ defaultDataProjection: 'EPSG:3857' }) }) }), style: style }) }; - Finally, add two clustered vector layers with different source URLs and styling functions:
map.addLayer(createClusteredLayer('points1.geojson', style1));
map.addLayer(createClusteredLayer('points2.geojson', style2));
Much of the code here should look familiar to the earlier recipes in this chapter. Let's take a closer look at some of the newly utilized properties and custom JavaScript that is implemented in this recipe.
We will begin by breaking down what the style1 function does of type ol.style.StyleFunction (a method of styling we saw earlier in the Styling based on feature attributes recipe):
var style1 = function(feature) {
  var length = feature.get('features').length;
  var styles = [
    new ol.style.Style({
      image: new ol.style.RegularShape({
        radius: 20, points: 4,
        stroke: new ol.style.Stroke({
          color: [1, 115, 54, 0.9], width: 2
        }),
We store a reference of the feature length (cluster count) in a variable, namely length. This is what gets used for the text label.
We create a new instance of ol.style.Style and assign a customized ol.style.RegularShape instance to the image property. We used this type of styling in order to create a star geometry for the Styling features based on geometry type recipe. However, this time we use it to create a square geometry (points is assigned as 4—the number of polygon sides).
text: new ol.style.Text({
  text: length.toString(), rotation: -0.3,
This snippet is also plucked from the style1 function. We can see that when we instantiate a new instance of ol.style.Text (for the cluster label), we use the count from the length variable, being sure to convert it to type string, as well as setting the text rotation to something nondefault, via the rotation property. The value is in radians, and produces a slanting effect.
if (length > 15) {
    styles.push(new ol.style.Style({
      image: new ol.style.Icon({
        src: '../../assets/images/arrow-left.png',
        rotation: -0.3, scale: 1.2,
        anchor: [-0.2, 0.5]
      })
    }))
  }
The last major part of the style1 function is the preceding conditional check on the feature count for the cluster.
If the number of features within the cluster is greater than 15, then we push another instance of ol.style.Style in the array before returning the completed styles array. We instantiate an instance of ol.style.Icon to provide this cluster feature with an icon of an arrow. Just like the text label, we rotate the icon by 0.3 radians, and we also scale up the icon by 20% of its original size (1.2).
The anchor property contains the x,y anchor points for the icon using fraction units (you can adjust it to use pixel units via the anchorXUnits or anchorYUnits properties). The default uses the fraction units of [0.5, 0.5]. We modified this so that the arrow is offset over to the right of the cluster's center, with -0.2 instead of 0.5.
Let's move on to take a look at the style2 function by extracting just a few portions of the method for discussion:
image: new ol.style.RegularShape({
  radius: 20, points: 3,
Again, we've used an instance of ol.style.RegularShape to customize the geometry that is used for the cluster feature. With the points property assigned a value of 3 sides, it produces a triangle.
text: new ol.style.Text({
  text: length.toString(), offsetY: 9,
  font: '12px "Arial Black"',
This snippet is the last snippet of the style2 function that we'll look over. It creates an instance of the text style constructor. The newly-introduced property is offsetY, which is used to vertically align the text label (cluster feature count) towards the bottom of the triangle. The typography used is a thicker style of font (Arial Black).
var createClusteredLayer = function(url, style) {
  return new ol.layer.Vector({
    source: new ol.source.Cluster({
      distance: 25, projection: 'EPSG:3857',
      source: new ol.source.Vector({
        url: url
        format: new ol.format.GeoJSON({
          defaultDataProjection: 'EPSG:3857'
        })
      })
    }),
    style: style
  })
};
We created a function to return a customized instance of a vector layer. The function accepts the parameters of url for the source URL, and style for the style function to be used by the layer.
We specified the projection as EPSG:3857 on the cluster instance (ol.source.Cluster) via the projection property, and we have also been explicit about the projection when formatting the GeoJSON via the defaultDataProjection property.
The style function is applied to the vector layer style property, which means that the layer styling rules will be applied to every feature within the layer.
- The Styling interaction render intents recipe
- The Styling features based on geometry type recipe
- The Using the cluster strategy recipe in Chapter 3, Working with Vector Layers