Table of Contents for
OpenLayers 3.x Cookbook - Second Edition
 OpenLayers 3.x Cookbook - Second Edition
Published by
Packt Publishing, 2016
OpenLayers 3.x Cookbook - Second Edition
Published by
Packt Publishing, 2016
- Cover
- Table of Contents
- OpenLayers 3.x Cookbook Second Edition
- OpenLayers 3.x Cookbook Second Edition
- Credits
- About the Authors
- About the Reviewer
- www.PacktPub.com
- Preface
- What you need for this book
- Who this book is for
- Sections
- Conventions
- Reader feedback
- Customer support
- 1. Web Mapping Basics
- Creating a simple fullscreen map
- Playing with the map's options
- Managing the map's stack layers
- Managing the map's controls
- Moving around the map view
- Restricting the map's extent
- 2. Adding Raster Layers
- Using Bing imagery
- Using OpenStreetMap imagery
- Adding WMS layers
- Changing the zoom effect
- Changing layer opacity
- Buffering the layer data to improve map navigation
- Creating an image layer
- Setting the tile size in WMS layers
- 3. Working with Vector Layers
- Adding a GML layer
- Adding a KML layer
- Creating features programmatically
- Exporting features as GeoJSON
- Reading and creating features from a WKT
- Using point features as markers
- Removing or cloning features using overlays
- Zooming to the extent of a layer
- Adding text labels to geometry points
- Adding features from a WFS server
- Using the cluster strategy
- Reading features directly using AJAX
- Creating a heat map
- 4. Working with Events
- Creating a side-by-side map comparator
- Implementing a work-in-progress indicator for map layers
- Listening for the vector layer features' events
- Listening for mouse or touch events
- Using the keyboard to pan or zoom
- 5. Adding Controls
- Adding and removing controls
- Working with geolocation
- Placing controls outside the map
- Drawing features across multiple vector layers
- Modifying features
- Measuring distances and areas
- Getting feature information from a data source
- Getting information from a WMS server
- 6. Styling Features
- Styling layers
- Styling features based on geometry type
- Styling based on feature attributes
- Styling interaction render intents
- Styling clustered features
- 7. Beyond the Basics
- Working with projections
- Creating a custom control
- Selecting features by dragging out a selection area
- Transitioning between weather forecast imagery
- Using the custom OpenLayers library build
- Drawing in freehand mode
- Modifying layer appearance
- Adding features to the vector layer by dragging and dropping them
- Making use of map permalinks
- Index
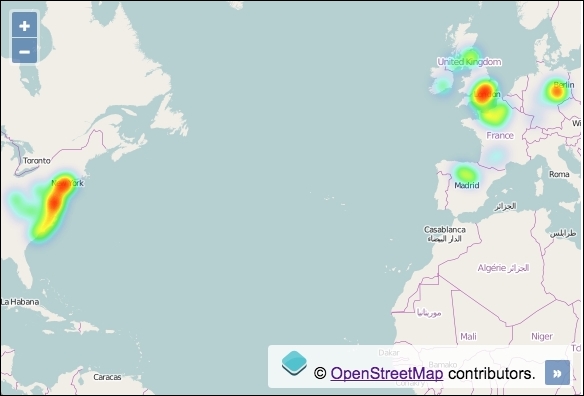
When you consider heat maps, you may literally think of an application that is used to visualize heat distribution across the planet, which is definitely an appropriate use case. You can, however, adapt the heat map effect to convey other properties, such as the relative quantity of any data type within areas. The more intense the 'heat', the more dense the information underneath.
For example, imagine a map that reflects how many users are currently online, playing your favorite game. We can specify locations with a weight attribute, which is indicative of the amount of players online for that geographic location. This is the scenario we'll go with for this recipe and can be seen in the following screenshot:
The source code can be found in ch03/ch03-heat-map.
Here's how to build a heat map of some fictional online users:
- Create an HTML file and add the OpenLayers dependencies and also a
divelement to hold the map. - Next, initialize the
map, add a raster layer, and set upview:var map = new ol.Map({ view: new ol.View({ zoom: 3, center: [-4187526, 4481044] }), target: 'js-map', layers: [ new ol.layer.Tile({ source: new ol.source.OSM() }) ] }); - Finish off by creating a heat map layer with a source reaching out to a GeoJSON file of geometry points. Add this layer to the map:
map.addLayer(new ol.layer.Heatmap({
  source: new ol.source.Vector({
    url: 'users-online.json',
    format: new ol.format.GeoJSON({
      defaultDataProjection: 'EPSG:3857'
    })
  })
}));
You'll notice that creating a heat map with the default settings in OpenLayers is very straightforward. Let's look over the creation of the heat layer:
map.addLayer(new ol.layer.Heatmap({
  source: new ol.source.Vector({
The heat map layer, ol.layer.Heatmap, extends the ol.layer.Vector class. This extension offers many styling properties for the heat effect that we haven't modified for this example, such as gradient (where you can explicitly choose the color palette used for the heat intensity increments) and the self-explanatory blur and shadow properties. I encourage you to familiarize yourself with the other available properties for the heat layer.
  url: 'users-online.json',
  format: new ol.format.GeoJSON({
    defaultDataProjection: 'EPSG:3857'
  })
The vector source points to an external GeoJSON file (users-online.json) and parses it through the GeoJSON formatter. OpenLayers takes care of the AJAX request for us.
The GeoJSON file contains a series of geometry points. Importantly, every point feature has a weight attribute. For example, here's one of the points taken directly from the GeoJSON file:
{
  "type": "Feature",
  "geometry": {
    "type": "Point",
    "coordinates": [-342437, 7435794]
  },
  "properties": {
     "weight": 0.6
  }
}
When OpenLayers reads this feature for heat layers, it looks for a feature property called weight. The weight attribute (which must be between 0 and 1) reflects the intensity at this location. In other words, 1 infers a high amount of users online and 0.1 infers a low amount of users online.
The feature attribute doesn't have to be named weight, though. You can name it something arbitrary and inform OpenLayers what the attribute is called via the weight property of ol.layer.Heatmap.
Within the GeoJSON formatter (ol.format.GeoJSON), we inform OpenLayers (via the defaultDataProjection property) that the coordinates within the file belong to the EPSG:3857 projection so that they render correctly on the map.
This recipe concludes our exploration of vector layers. We've learned how to create layers with appropriate strategies for the data, how to integrate with external geometry sources in a variety of different formats, how to package up layer data for export, how to interact with features on these layers, and also some basic feature manipulation and styling.
- The Adding a GML layer recipe
- The Using the cluster strategy recipe
- The Modifying layer appearance recipe from Chapter 7, Beyond the Basics.