Table of Contents for
OpenLayers 3.x Cookbook - Second Edition
 OpenLayers 3.x Cookbook - Second Edition
Published by
Packt Publishing, 2016
OpenLayers 3.x Cookbook - Second Edition
Published by
Packt Publishing, 2016
- Cover
- Table of Contents
- OpenLayers 3.x Cookbook Second Edition
- OpenLayers 3.x Cookbook Second Edition
- Credits
- About the Authors
- About the Reviewer
- www.PacktPub.com
- Preface
- What you need for this book
- Who this book is for
- Sections
- Conventions
- Reader feedback
- Customer support
- 1. Web Mapping Basics
- Creating a simple fullscreen map
- Playing with the map's options
- Managing the map's stack layers
- Managing the map's controls
- Moving around the map view
- Restricting the map's extent
- 2. Adding Raster Layers
- Using Bing imagery
- Using OpenStreetMap imagery
- Adding WMS layers
- Changing the zoom effect
- Changing layer opacity
- Buffering the layer data to improve map navigation
- Creating an image layer
- Setting the tile size in WMS layers
- 3. Working with Vector Layers
- Adding a GML layer
- Adding a KML layer
- Creating features programmatically
- Exporting features as GeoJSON
- Reading and creating features from a WKT
- Using point features as markers
- Removing or cloning features using overlays
- Zooming to the extent of a layer
- Adding text labels to geometry points
- Adding features from a WFS server
- Using the cluster strategy
- Reading features directly using AJAX
- Creating a heat map
- 4. Working with Events
- Creating a side-by-side map comparator
- Implementing a work-in-progress indicator for map layers
- Listening for the vector layer features' events
- Listening for mouse or touch events
- Using the keyboard to pan or zoom
- 5. Adding Controls
- Adding and removing controls
- Working with geolocation
- Placing controls outside the map
- Drawing features across multiple vector layers
- Modifying features
- Measuring distances and areas
- Getting feature information from a data source
- Getting information from a WMS server
- 6. Styling Features
- Styling layers
- Styling features based on geometry type
- Styling based on feature attributes
- Styling interaction render intents
- Styling clustered features
- 7. Beyond the Basics
- Working with projections
- Creating a custom control
- Selecting features by dragging out a selection area
- Transitioning between weather forecast imagery
- Using the custom OpenLayers library build
- Drawing in freehand mode
- Modifying layer appearance
- Adding features to the vector layer by dragging and dropping them
- Making use of map permalinks
- Index
To demonstrate some of the feature styling options that are available, we'll create a live editor in the side panel to style the features that are already loaded on to the map. To achieve this goal, we'll be using the jQuery UI library to create sliders and the jQuery plugin Spectrum for the color picker widget. The source code can be found in ch06/ch06-styling-layers. We'll end up with something that looks similar to the following screenshot:
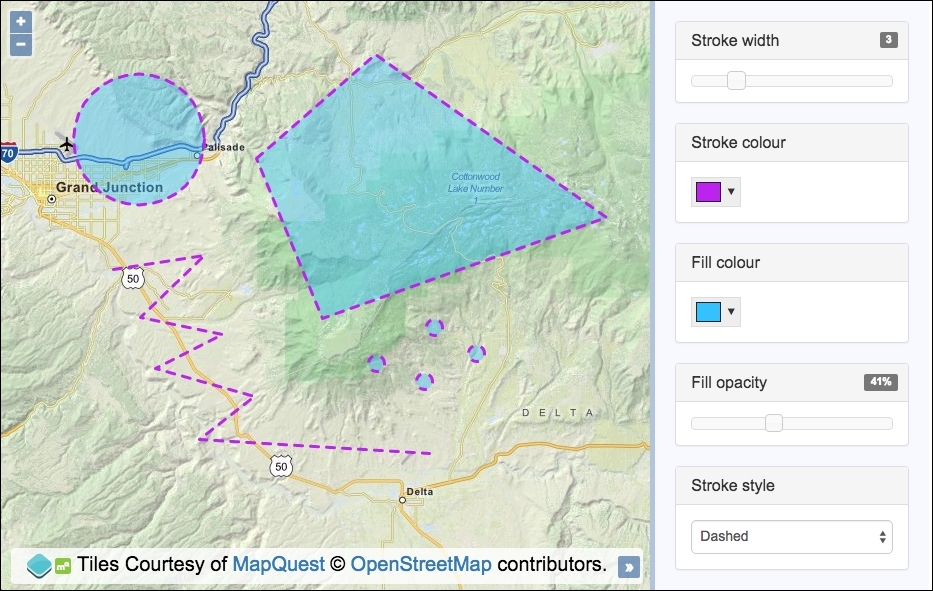
For this recipe, we are going to apply styles at the layer level so that all features within a layer inherit the styling. The current state of all customizable styles will be reflected in the sidebar.
We'll be instantiating many instances of classes that belong to the ol.style object, such as ol.style.Stroke. Let's take a look at how this is implemented.
The source code has two main sections: one for HTML where all the controls are placed, and a second one for the JavaScript code.
The HTML section contains a lot of markup that gets converted to interactive widgets by the JavaScript, such as the slider and color picker. As mentioned earlier, we've also used the jQuery, jQuery UI (https://jqueryui.com) and Spectrum (https://bgrins.github.io/spectrum) libraries. As they're not the goal of this recipe, the HTML won't be listed out in the How to do it… section. I encourage you to take a look at the code in the code bundle of this book.
In order to create your own customized layer styling, follow these instructions:
- After creating the HTML file, including OpenLayers dependencies and other library dependencies (refer to the Getting ready section for the HTML code), create a custom JavaScript file and instantiate a new
mapinstance, as follows:var map = new ol.Map({ view: new ol.View({ zoom: 10, center: [-12036691, 4697972] }), target: 'js-map', layers: [ new ol.layer.Tile({ source: new ol.source.MapQuest({layer: 'osm'}) }) ] }); - Create a vector layer for the
sourceinstance that loads in a GeoJSON file of features:var vectorLayer = new ol.layer.Vector({ source: new ol.source.Vector({ url: 'features.geojson', format: new ol.format.GeoJSON({ defaultDataProjection: 'EPSG:3857' }) }) }); - Set up the function that brings the styling together so that it can be used to set the complete vector layer styling, as follows:
var setStyles = function() { vectorLayer.setStyle(new ol.style.Style({ stroke: strokeStyle(), fill: fillStyle(), image: new ol.style.Circle({ fill: fillStyle(), stroke: strokeStyle(), radius: 8 }) })); }; - Set up the
stroke-widthandfill-opacitysliders with the jQuery UI. The handlers for theslideaction call oursetStylesmethod, and they display the relevant value in the DOM for the user to see, as follows:$('#js-stroke-width').slider({ min: 1, max: 10, step: 1, value: 1, slide: function(event, ui) { $('#js-stroke-width-value').text(ui.value); setStyles(); } }); $('#js-fill-opacity').slider({ min: 0, max: 100, step: 1, value: 50, slide: function(event, ui) { $('#js-fill-opacity-value').text(ui.value + '%'); setStyles(); } }); - Convert the markup for the
strokeandfillcolors to interactive color pickers with the help of the Spectrum jQuery plugin. When a new color is chosen, call oursetStylesmethod:$('#js-stroke-color, #js-fill-color').spectrum({ color: 'black', change: setStyles }); - Listen for changes in the stroke line style
selectmenu and call oursetStylesmethod:$('#js-stroke-style').on('change', setStyles); - Set up the function that returns the fill style, as follows:
var fillStyle = function() { var rgb = $('#js-fill-color').spectrum('get').toRgb(); return new ol.style.Fill({ color: [ rgb.r, rgb.g, rgb.b, $('#js-fill-opacity').slider('value') / 100 ] }); }; - Set up the function that returns the stroke style, as follows:
var strokeStyle = function() { return new ol.style.Stroke({ color: $('#js-stroke-color').spectrum('get').toHexString(), width: $('#js-stroke-width').slider('value'), lineDash: $('#js-stroke-style').val() === 'solid' ? undefined : [8] }); }; - Finish off by calling the
setStylesfunction and add the vector layer to themapinstance, as follows:setStyles(); map.addLayer(vectorLayer);
There's a lot of JavaScript to cover here if we take it line by line. What we're going to do instead is pluck out enough of the key functionality that will allow you to make sense of the overall code yourself:
var setStyles = function() {
vectorLayer.setStyle(new ol.style.Style({
stroke: strokeStyle(),
fill: fillStyle(),
image: new ol.style.Circle({
fill: fillStyle(),
stroke: strokeStyle(),
radius: 8
})
}));
};We create a function, namely setStyles, that'll be called from multiple places in the code when the user customizes the styling in the side panel. When this method is called, it returns a completed instance of the ol.style.Style object and passes it to the vector layer's setStyle method. This, in turn, causes the features on the map to be rerendered with the latest styling configuration.
The stroke property of ol.style.Style is assigned the value of the stroke style that is generated by the strokeStyle method, and the fill property is generated by the fillStyle method.
The image property is an instance of the ol.style.Circle styling object, which is the geometry type that point geometries are presented with. We repeat our usage of the fill and stroke methods to provide the values for the fill and stroke properties. We set a static radius of 8 for the circle style.
$('#js-stroke-width').slider({
min: 1, max: 10, step: 1, value: 1,
slide: function(event, ui) {
$('#js-stroke-width-value').text(ui.value);
setStyles();
}
});Let's take a look at just one of the jQuery slider setups for the stroke width. Once you're familiar with this slider function, you'll be able to ascertain how the other slider function for the fill opacity fits into the implementation of this recipe yourself.
We've limited the width to lie between 1 and 10, inclusive (with the min and max properties), and the default width is 1. We register a handler for the slide action that displays the updated value in the ($('#js-stroke-width-value').text(ui.value)) sidebar; this does not influence the style of the actual features against the map yet.
We then call our setStyles method, as we want the latest styling to be immediately reflected on the map.
$('#js-stroke-color, #js-fill-color').spectrum({
  color: 'black', change: setStyles
});The other widget type that we'll cover in this chapter is for the color picker (we won't cover the handler for the stroke style select menu as it should be easy enough to follow).
Within the jQuery selector, we selected both color input elements for fill and stroke, passing in a default color of black and a handler that calls our setStyles method when a new color is selected.
var fillStyle = function() {
  var rgb = $('#js-fill-color').spectrum('get').toRgb();
  return new ol.style.Fill({
    color: [
      rgb.r, rgb.g, rgb.b,
      $('#js-fill-opacity').slider('value') / 100
    ]
  });
};The fill color (from the color picker) was retained by Spectrum when we initialized the widget from the DOM element and whenever it's updated by the user. To dynamically retrieve the latest color, we access the same DOM element and call the get method followed by the toRgb method—both from Spectrum, storing the result in the rgb variable. The result is an object with the red value assigned to the r property, and so on for the green and blue values.
We both instantiate and return an instance of ol.style.Fill, which accepts a single object property of color. This value can be an array of OpenLayer's type ol.Color ([red, green, blue, alpha]). We retrieve and populate the array with the RGB values, followed by the alpha value.
The alpha value is taken from the jQuery UI slider DOM element (slider('value')). This number is transformed into a float. For example, 55; in this case, we divide 55 by 100 (0.55). This is important, as the ol.Color type array expects the alpha to be a float value from 0-1, inclusive.
As we saw earlier in this recipe, our setStyles method uses the fillStyle method to populate some of its properties.
var strokeStyle = function() {
  return new ol.style.Stroke({
    color: $('#js-stroke-color').spectrum('get').toHexString(),
    width: $('#js-stroke-width').slider('value'),
    lineDash: $('#js-stroke-style').val() === 'solid'
      ? undefined : [8]
  });
};Similar to our fillStyle function, an instance of the stroke style constructor (ol.style.Stroke) is both returned and instantiated at the same time. More properties are available for stroke styling, from which we populate the color, width, and lineDash properties with values.
For the color property, we once again utilize Spectrum to retrieve the value of the latest color picker DOM element, but this time, we pass it through the toHexString library method, producing the color in string hex format. The color property for ol.style.Stroke can also accept an ol.Color array as well.
For the width property, we simply grab the value directly from the jQuery slider DOM element.
The value for the lineDash property is inferred from the user's selection. If a user has selected None (which has an option value of solid) from the select menu, then we pass in undefined, which means that no dash is required for the stroke instance. Otherwise, we pass in an array with a single number entry of 8.
When you pass in an array of numbers, you're defining a dashed pattern. The numbers represent the length of the alternating dashes and gaps. So, 8 on its own, as we've done here, is the equivalent of [8, 8] (the gap is assumed to be the same length as the dash).
You can design far more complex patterns at your own discretion. I encourage you to play around with other options. Mozilla has a useful guide on stroke dash arrays at https://developer.mozilla.org/en/docs/Web/SVG/Attribute/stroke-dasharray.
The ol.style.Stroke constructor accepts other properties, such as lineCap, and lineJoin, that you may find interesting.
A question that can arise here is, what takes precedence when styling, a rule applied to a vector layer or styles applied directly to a single feature?
The answer is that styles go from bottom to top. This means that if we have specified a style directly on a feature, then this will be used to render it. Otherwise, any styles assigned to the vector layer will be applied to its features.