Table of Contents for
OpenLayers 3.x Cookbook - Second Edition
 OpenLayers 3.x Cookbook - Second Edition
Published by
Packt Publishing, 2016
OpenLayers 3.x Cookbook - Second Edition
Published by
Packt Publishing, 2016
- Cover
- Table of Contents
- OpenLayers 3.x Cookbook Second Edition
- OpenLayers 3.x Cookbook Second Edition
- Credits
- About the Authors
- About the Reviewer
- www.PacktPub.com
- Preface
- What you need for this book
- Who this book is for
- Sections
- Conventions
- Reader feedback
- Customer support
- 1. Web Mapping Basics
- Creating a simple fullscreen map
- Playing with the map's options
- Managing the map's stack layers
- Managing the map's controls
- Moving around the map view
- Restricting the map's extent
- 2. Adding Raster Layers
- Using Bing imagery
- Using OpenStreetMap imagery
- Adding WMS layers
- Changing the zoom effect
- Changing layer opacity
- Buffering the layer data to improve map navigation
- Creating an image layer
- Setting the tile size in WMS layers
- 3. Working with Vector Layers
- Adding a GML layer
- Adding a KML layer
- Creating features programmatically
- Exporting features as GeoJSON
- Reading and creating features from a WKT
- Using point features as markers
- Removing or cloning features using overlays
- Zooming to the extent of a layer
- Adding text labels to geometry points
- Adding features from a WFS server
- Using the cluster strategy
- Reading features directly using AJAX
- Creating a heat map
- 4. Working with Events
- Creating a side-by-side map comparator
- Implementing a work-in-progress indicator for map layers
- Listening for the vector layer features' events
- Listening for mouse or touch events
- Using the keyboard to pan or zoom
- 5. Adding Controls
- Adding and removing controls
- Working with geolocation
- Placing controls outside the map
- Drawing features across multiple vector layers
- Modifying features
- Measuring distances and areas
- Getting feature information from a data source
- Getting information from a WMS server
- 6. Styling Features
- Styling layers
- Styling features based on geometry type
- Styling based on feature attributes
- Styling interaction render intents
- Styling clustered features
- 7. Beyond the Basics
- Working with projections
- Creating a custom control
- Selecting features by dragging out a selection area
- Transitioning between weather forecast imagery
- Using the custom OpenLayers library build
- Drawing in freehand mode
- Modifying layer appearance
- Adding features to the vector layer by dragging and dropping them
- Making use of map permalinks
- Index
Map navigation is an important factor to take into account for a good user experience. When we pan and zoom the map, you'll often notice blank areas during transitions (because the content is loading), and after a few moments, the tile images appear.
On gridded layers (the focus of this recipe) and WMS layers working in single image mode, we can improve this at the cost of increasing the number of requests or increasing the computation time at the server side.
The idea behind improving map navigation is simple; load the tiles beyond the map view so that they are loaded before the user pans the map view in this direction or changes resolution, thus improving the navigation experience for users.
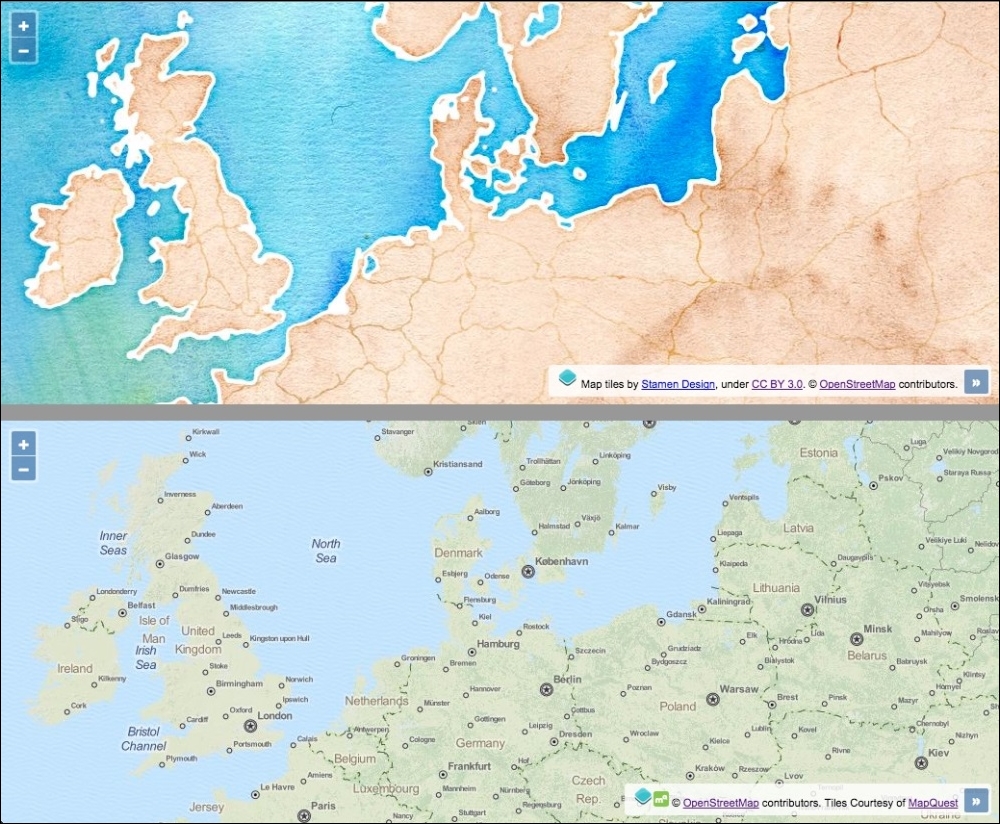
For this recipe we will create two side by side maps with tiled layers, one with (the top map) and one without (the bottom map) tile buffering enabled. You'll be able to see the differences when navigating around the two maps. The source code for this recipe can be found in ch02/ch02-layer-preloading/.
Let's produce this recipe using the steps outlined as follows:
- Create an HTML file and include the OpenLayers dependencies. In particular, we create two
divelements to hold both maps with a central divide:<div id="js-map-preload"></div> <hr/> <div id="js-map-no-preload"></div>
- Create a
viewinstance that has to be shared by both maps:var view = new ol.View({ zoom: 5, center: [1252000, 7240000] }); - Create the map with preloading enabled, as follows:
new ol.Map({ view: view, target: 'js-map-preload', layers: [ new ol.layer.Tile({ source: new ol.source.Stamen({ layer: 'watercolor' }), preload: Infinity }) ] }); - Create the comparison map, with no preloading techniques:
new ol.Map({
  view: view,
  target: 'js-map-no-preload',
  layers: [
    new ol.layer.Tile({
      source: new ol.source.MapQuest({
        layer: 'osm'
      })
    })
  ]
});
The HTML and CSS split the page in two, with a clear horizontal divide. We won't go into any more details for this, but please do check out the source code for this recipe.
The view created is used for both map instances. This means that when one map updates the view, the changes will be mirrored by the other map instance. It's this easy to have two maps imitate each other.
layers: [
  new ol.layer.Tile({
    source: new ol.source.Stamen({
      layer: 'watercolor'
    }),
    preload: Infinity
  })
]
This first map instance uses the watercolor layer source from Stamen. For the ol.layer.Tile configuration, we set the preload property to Infinity. The preload property instructs OpenLayers to load in tiles of lower resolutions (for the current extent) up to the specified level.
In theory, to the same effect, the value of preload could be set to the quantity of lower resolution levels from the currently visible layer. However, rather than figuring this out manually, we put in place Infinity, for convenience so that all lower resolution levels will be taken into account. In this scenario, we could have arbitrarily chosen a preload value of 100 for the same outcome.
To further understand this, let's explain what the preload setting actually does. Firstly, let's visualize this explanation somewhat: go and remind yourself what the top map looks like from the recipe screenshot at the beginning of this topic. Given the tile images that you see before you that make up the top map, be aware that the following map tile (at a lower resolution) has been additionally preloaded behind the scenes, but it isn't currently visible:
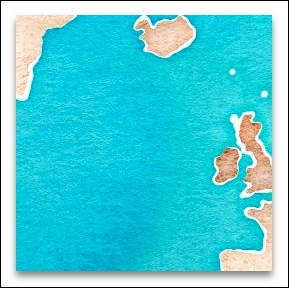
This is not the only preloaded tile at a lower resolution either—there are others of lower resolutions that cover the viewable extent.
Note
For a deeper dive, run this recipe in the browser and inspect the network requests for this layer (using the browser development tools). You'll observe that the extent of the viewport has lower resolution tiles preloaded all the way to the lowest available resolution for this layer. It has done this because we specified a preload value of Infinity. If we had specified a preload value of, say 2, then OpenLayers would have restricted preloading to just 2 lower resolutions beyond the currently visible resolution.
Due to the implemented preloading mechanism, blank areas are greatly reduced (if not eliminated, depending on network latency, and so on). On the contrary, when navigating around the MapQuest tile layer (with no preloading), you should be able to observe blank areas appearing much more frequently than the preloaded Stamen layer.
OpenLayers doesn't preload higher resolution tiles, as it doesn't really need to. This is because when you zoom in, the currently visible tiles are automatically increased in size (creating an illusion of getting closer towards the point of interest) so that no blank areas are revealed. When the new tiles are loaded and available from the requests, the old tiles are removed from the map to reveal the new tiles underneath.
To enable custom layer buffering in single image mode with WMS layers (through the use of ol.layer.Image), you can adjust the ratio property of ol.source.ImageWMS. By adjusting the ratio, we can control the image size that is returned from the server. A ratio value of 1 means that an image with the exact dimensions of the map view is requested. By default, the ratio value is set to 1.5, which means we are requesting an image with the map view dimensions plus a half. You could decide to increase this ratio amount as desired.
Just because you can utilize preloading, it doesn't necessarily mean it's always the most preferable solution. Consider mobile phone users with limited amounts of data allowance on lower bandwidth connections. You may actually end up negatively impacting their user experience. Loading more tiles inevitably means more image requests to the server and more data to download to the device.
The same applies to a WMS layer in single image mode; the greater the bounding box you request, the greater the computation time on the server and the larger the image size for download. With this in mind, increasing the preload or ratio values too much is not always the best solution.
Consider how your users will likely navigate the map and explore the data. If your data is probably better explored in its extension, then a preload of one, or two, or a larger ratio could be a good idea.