Table of Contents for
OpenLayers 3.x Cookbook - Second Edition
 OpenLayers 3.x Cookbook - Second Edition
Published by
Packt Publishing, 2016
OpenLayers 3.x Cookbook - Second Edition
Published by
Packt Publishing, 2016
- Cover
- Table of Contents
- OpenLayers 3.x Cookbook Second Edition
- OpenLayers 3.x Cookbook Second Edition
- Credits
- About the Authors
- About the Reviewer
- www.PacktPub.com
- Preface
- What you need for this book
- Who this book is for
- Sections
- Conventions
- Reader feedback
- Customer support
- 1. Web Mapping Basics
- Creating a simple fullscreen map
- Playing with the map's options
- Managing the map's stack layers
- Managing the map's controls
- Moving around the map view
- Restricting the map's extent
- 2. Adding Raster Layers
- Using Bing imagery
- Using OpenStreetMap imagery
- Adding WMS layers
- Changing the zoom effect
- Changing layer opacity
- Buffering the layer data to improve map navigation
- Creating an image layer
- Setting the tile size in WMS layers
- 3. Working with Vector Layers
- Adding a GML layer
- Adding a KML layer
- Creating features programmatically
- Exporting features as GeoJSON
- Reading and creating features from a WKT
- Using point features as markers
- Removing or cloning features using overlays
- Zooming to the extent of a layer
- Adding text labels to geometry points
- Adding features from a WFS server
- Using the cluster strategy
- Reading features directly using AJAX
- Creating a heat map
- 4. Working with Events
- Creating a side-by-side map comparator
- Implementing a work-in-progress indicator for map layers
- Listening for the vector layer features' events
- Listening for mouse or touch events
- Using the keyboard to pan or zoom
- 5. Adding Controls
- Adding and removing controls
- Working with geolocation
- Placing controls outside the map
- Drawing features across multiple vector layers
- Modifying features
- Measuring distances and areas
- Getting feature information from a data source
- Getting information from a WMS server
- 6. Styling Features
- Styling layers
- Styling features based on geometry type
- Styling based on feature attributes
- Styling interaction render intents
- Styling clustered features
- 7. Beyond the Basics
- Working with projections
- Creating a custom control
- Selecting features by dragging out a selection area
- Transitioning between weather forecast imagery
- Using the custom OpenLayers library build
- Drawing in freehand mode
- Modifying layer appearance
- Adding features to the vector layer by dragging and dropping them
- Making use of map permalinks
- Index
We've seen various ways to add vector features to a map, such as in the recipes, Adding a GML layer from this chapter, and Creating features programmatically in Chapter 3, Working with Vector Layers. Sometimes, however, we may want to provide the user with drawing capabilities so that they can manually draw almost any shape they like on the map.
For example, you may want the user to mark out a point of interest at a location by drawing a polygon over an area for building planning purposes.
OpenLayers has an abundance of controls (more accurately, interactions) that we can add to the map for exactly this type of purpose.
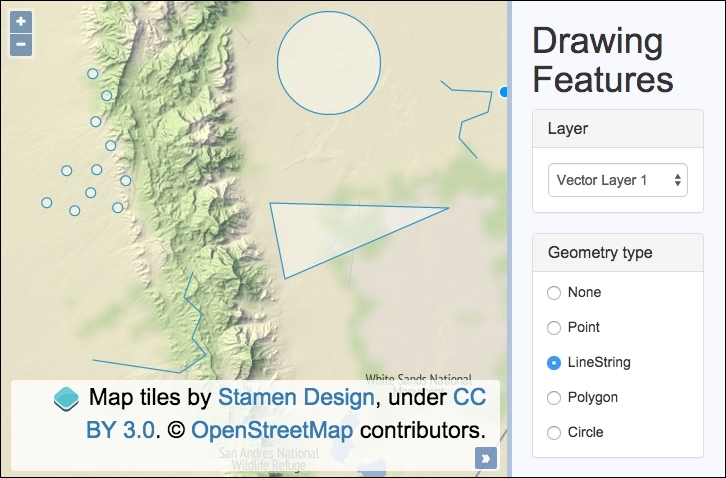
In this recipe, we will allow the user to draw from a selection of different geometry types (Point, LineString, Polygon, and Circle) and add them to a vector layer of their choice. The source code can be found in ch05/ch05-drawing-features, and this will look like the following:
Find out how to draw different vector feature types over multiple vector layers by following these instructions:
- Create an HTML file with OpenLayers dependencies, jQuery, and
divto hold the map. In particular, we need aselectmenu with the available vector layers to choose from and theradiobuttons so that a geometry type can be picked:<select id="js-layer-select"> <option value="vectorLayer1">Vector Layer 1</option> <option value="vectorLayer2">Vector Layer 2</option> </select> <label> <input type="radio" name="geometries" value="None" checked> None </label> <label> <input type="radio" name="geometries" value="Point"> Point </label> <label> <input type="radio" name="geometries" value="LineString"> LineString </label> <label> <input type="radio" name="geometries" value="Polygon"> Polygon </label> <label> <input type="radio" name="geometries" value="Circle"> Circle </label>
- Create a custom JavaScript file and set up the two vector layers:
var vectorLayer1 = new ol.layer.Vector({ source: new ol.source.Vector() }); var vectorLayer2 = new ol.layer.Vector({ source: new ol.source.Vector() }); - Instantiate
mapwith aviewinstance and a tile layer and add the vector layers:var map = new ol.Map({ view: new ol.View({ zoom: 10, center: [-11863791, 3898899] }), target: 'js-map', layers: [ new ol.layer.Tile({ source: new ol.source.Stamen({ layer: 'terrain' })}), vectorLayer1, vectorLayer2 ] }); - Cache some DOM elements and set up a variable to hold the drawing control:
var layerSelect = $('#js-layer-select'); var geomRadios = $('[name=geometries]'); var drawControl; - Create the function that will update the drawing control accordingly:
var updateDrawControl = function() { var geometryType = geomRadios.filter(':checked').val(); map.removeInteraction(drawControl); if (geometryType === 'None') return; drawControl = new ol.interaction.Draw({ type: geometryType, source: window[layerSelect.val()].getSource() }); map.addInteraction(drawControl); }; - Finally, subscribe to the
changeevent on both theselectmenu and theradioinputs, and set theupdateDrawControlfunction as the handler for both:layerSelect.on('change', updateDrawControl); geomRadios.on('change', updateDrawControl);
As we have done in other recipes, the CSS framework, Bootstrap, has been used to style the sidebar content. To see the full HTML and CSS, please view the source code, as it's unfortunately too large to include in this book.
The focus of this section will be on the function that we created, namely updateDrawControl, as this is where the core of the logic takes place. It is also where the code may look the least familiar to the other recipes that you've seen up to now.
Let's begin digesting each piece of the function, which is called whenever the vector layer is changed from the select menu or when a geometry type is changed from the radio inputs:
var updateDrawControl = function() {
  var geometryType = geomRadios.filter(':checked').val();
We cache the type of geometry that the user has selected from the radio input list to a variable, namely geometryType. This is achieved with the help of jQuery's method, filter, which loops over the collection (the list of radio input elements) and determines whether the input is checked (because of the :checked condition passed in).
If the radio input during iteration is checked, the filter method returns the matching DOM element from the collection, from which we retrieve the input value via the val method, which is also from jQuery. For example, this may be equal to 'Circle', 'LineString' or any of the other options the user may have chosen.
  map.removeInteraction(drawControl);
  if (geometryType === 'None') return;
This section of the function first removes any previous instance of the drawing interaction (control) from the map. We do this because we must instantiate interaction with the latest settings from the combination of the select menu (layer) and radio inputs (geometry type). Within the confinements of the OpenLayers API, we can't update the geometry type or layer without destroying and then recreating the interaction.
Afterwards, we have a conditional if statement to see whether or not the user has selected 'None' from the geometry types. This means that the user is not interested in drawing and intends to navigate the map instead. With the drawing interaction removed from the map, this is all we need to do in this scenario, so we break out of the function with an early return, job done.
  drawControl = new ol.interaction.Draw({
    type: geometryType,
    source: window[layerSelect.val()].getSource()
  });
  map.addInteraction(drawControl);
We assign the new instance of the drawing interaction to the variable drawControl. This is important as we need a reference of the interaction when we remove it from the map (as seen earlier in this function).
The type of geometry that the user wants to draw is set on the type property. The source property (vector source) needs to be one of our two vector layer sources. The vector layers are global variables, so they are properties of the window object. The values for the select options are equal to the names of the vector layer variables. This means that when Vector Layer 1 is selected, the value of vectorLayer1 is retrieved (remember, the HTML looks like this: <option value="vectorLayer1">Vector Layer 1</option>) via the jQuery val method. With the array notation lookup on the window object, we are able to reference the vector layer. For example, window[layerSelect.val()] could be the equivalent of window[vectorLayer1].
We call the getSource method from the vector layer and that's what gets provided to the source property.
The newly instantiated draw interaction is added to map, and so, the user can now craft out the feature over the map.
It's not necessarily obvious how to complete a drawing of a feature, so here's a breakdown:
- Point: This is when a single-click on the map draws a point.
- LineString/Polygon: This is when an initial single click adds the starting point and subsequent single clicks draw out new points of the feature. A double-click completes the geometry.
- Circle: This is when a single click on the map sets the center of the circle, then drag the mouse outwards until you're happy with the diameter, then single click again to complete the drawing. For mobile, a second single click at the desired radius completes the circle.
The ol.interaction.Draw class has many configurable properties at instantiation that may be of interest, such as minPoints and maxPoints, to restrict the amount of geometry points that the feature can have. There's also the features property, which will be the destination feature collection for the drawn features. We also take a look at the freehandCondition property in the recipe, Drawing in freehand mode, in Chapter 7, Beyond the Basics.
The ol.interaction.Draw class also publishes events that you may want to subscribe to, such as the self-explanatory drawend and drawstart events.
As well as the set geometry types out of the box that OpenLayers offers with the draw interaction, there are more advanced techniques that you can use to draw almost any shape that you may require.
The drawing interaction has a property named geometryFunction that accepts a function of type ol.interaction.DrawGeometryFunctionType function. This function is passed coordinates and the existing geometry as arguments, and it must return a new geometry.
With this method, you can manipulate drawing mechanisms, such as the circle geometry type, and instead draw out a square by dragging the mouse outwards from the point of the click. The ol.interaction.Draw class comes with a drawing geometry method that you can easily customize called ol.interaction.Draw.createRegularPolygon, which takes a number of sides and an angle as the arguments. To demonstrate drawing out a square (using the same gesture actions as when you draw a circle), you'd use the following:
drawControl = new ol.interaction.Draw({
  type: 'Circle',
  source: vectorLayer1.getSource(),
  geometryFunction: ol.interaction.Draw.createRegularPolygon(4)
});
This is an advanced topic that unfortunately won't be covered in any more detail throughout this book, but for more information visit the official example from OpenLayers on how to do this at http://openlayers.org/en/v3.13.1/examples/draw-features.html.