Table of Contents for
OpenLayers 3.x Cookbook - Second Edition
 OpenLayers 3.x Cookbook - Second Edition
Published by
Packt Publishing, 2016
OpenLayers 3.x Cookbook - Second Edition
Published by
Packt Publishing, 2016
- Cover
- Table of Contents
- OpenLayers 3.x Cookbook Second Edition
- OpenLayers 3.x Cookbook Second Edition
- Credits
- About the Authors
- About the Reviewer
- www.PacktPub.com
- Preface
- What you need for this book
- Who this book is for
- Sections
- Conventions
- Reader feedback
- Customer support
- 1. Web Mapping Basics
- Creating a simple fullscreen map
- Playing with the map's options
- Managing the map's stack layers
- Managing the map's controls
- Moving around the map view
- Restricting the map's extent
- 2. Adding Raster Layers
- Using Bing imagery
- Using OpenStreetMap imagery
- Adding WMS layers
- Changing the zoom effect
- Changing layer opacity
- Buffering the layer data to improve map navigation
- Creating an image layer
- Setting the tile size in WMS layers
- 3. Working with Vector Layers
- Adding a GML layer
- Adding a KML layer
- Creating features programmatically
- Exporting features as GeoJSON
- Reading and creating features from a WKT
- Using point features as markers
- Removing or cloning features using overlays
- Zooming to the extent of a layer
- Adding text labels to geometry points
- Adding features from a WFS server
- Using the cluster strategy
- Reading features directly using AJAX
- Creating a heat map
- 4. Working with Events
- Creating a side-by-side map comparator
- Implementing a work-in-progress indicator for map layers
- Listening for the vector layer features' events
- Listening for mouse or touch events
- Using the keyboard to pan or zoom
- 5. Adding Controls
- Adding and removing controls
- Working with geolocation
- Placing controls outside the map
- Drawing features across multiple vector layers
- Modifying features
- Measuring distances and areas
- Getting feature information from a data source
- Getting information from a WMS server
- 6. Styling Features
- Styling layers
- Styling features based on geometry type
- Styling based on feature attributes
- Styling interaction render intents
- Styling clustered features
- 7. Beyond the Basics
- Working with projections
- Creating a custom control
- Selecting features by dragging out a selection area
- Transitioning between weather forecast imagery
- Using the custom OpenLayers library build
- Drawing in freehand mode
- Modifying layer appearance
- Adding features to the vector layer by dragging and dropping them
- Making use of map permalinks
- Index
In the art of creating great applications, one of the most important things to take into account is the user experience. A good application does what it must do, but it does this by making the user feel comfortable.
When working with remote servers, a lot of time is spent waiting for data retrieval. For example, when working with a tile service, every time we change the zoom level or pan the map, the user has to wait for some time until the data is obtained from the server and the tiles start rendering.
It would be great to show some feedback to the user with a spinner icon, a progress bar, or other familiar visual cues that inform the user that the application is working but needs some time.
This recipe shows us how we can give some feedback to the user by displaying when the application is loading content from an external service, making use of some layer events.
The source code can be found in ch04/ch04-map-loading-progress. For convenience, you can also view this recipe at https://jsfiddle.net/pjlangley/qd6z4p8b/.
In order to create a map loading progress bar, perform the following steps:
- Create an HTML file with OpenLayers dependencies. In particular, we have the following markup:
<div id="js-map"></div>
<div class="progress">
  <div id="js-progress-bar"></div>
</div>
- Create a custom JavaScript file and set up the raster source and some other global variables that we'll use throughout the code:
var rasterSource = new ol.source.MapQuest({layer: 'sat'}); var progressBar = document.getElementById('js-progress-bar'); var tilesLoaded = 0; var tilesPending = 0; - Subscribe to some tile events on the source and update the progress bar accordingly when the tiles have finished loading:
rasterSource.on(['tileloadend', 'tileloaderror'], function() { ++tilesLoaded; var percentage = Math.round(tilesLoaded / tilesPending * 100); progressBar.style.width = percentage + '%'; if (percentage >= 100) { setTimeout(function() { progressBar.parentNode.style.opacity = 0; progressBar.style.width = 0; tilesLoaded = 0; tilesPending = 0; }, 600); } }); - Subscribe to one other source event and update the progress bar visibility and the quantity of tiles still pending:
rasterSource.on('tileloadstart', function() { progressBar.parentNode.style.opacity = 1; ++tilesPending; }); - Finally, instantiate a new map instance and attach the tile source:
new ol.Map({
  view: new ol.View({
    zoom: 5,
    center: [-6291073, -1027313]
  }),
  target: 'js-map',
  layers: [
    new ol.layer.Tile({
      source: rasterSource
    })
  ]
});
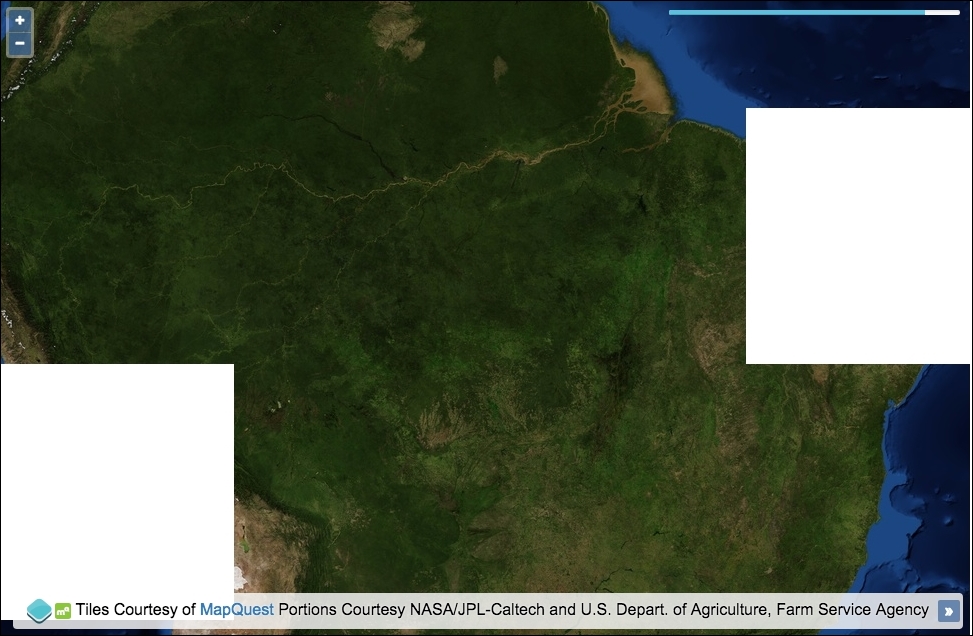
We placed a progress bar in the top-right corner of the map. We used the CSS framework Bootstrap to help with some of the styling. The CSS for this won't be covered in detail, so please view the source code for more on how it's achieved. The progress bar reflects the percentage of loaded tiles against those still in flight.
We're going to focus on the event subscriptions and how they influence the progress-loading bar. The rest of this code should look familiar from previous recipes:
rasterSource.on(['tileloadend', 'tileloaderror'], function() {
  ++tilesLoaded;
  var percentage = Math.round(tilesLoaded / tilesPending * 100);
  progressBar.style.width = percentage + '%';
Using the on method (which sources inherit from ol.Observable), we subscribe to two source event types (of type ol.source.TileEvent). The tileloadend event is published when a tile has been successfully loaded on the map. The tileloaderror event is published when a tile load has failed. It's important that we still capture the failed event type; otherwise, we'd lose track of the pending versus loaded state.
Our handler firstly increments the tilesLoaded count (which is originally set to 0). The percentage is calculated by dividing number of the loaded tiles by the total amount of tiles still pending, and then this is multiplied by 100 so that it can be used as a percentage for the progress bar width. For example, let's say two tiles have loaded, but eight are still pending. 2 / 8 = 0.25. 0.25 * 100 = 25.
When the width of the progress bar is set, we concatenate the percentage string onto the end of the number so that it can be used as a valid CSS value. The progress bar displays at 25% complete.
  if (percentage >= 100) {
    setTimeout(function() {
      progressBar.parentNode.style.opacity = 0;
      progressBar.style.width = 0;
      tilesLoaded = 0;
      tilesPending = 0;
    }, 600);
  }
Within the same handler, we check to see whether the percentage of loaded tiles has reached 100% or more. A user can trigger extra tile loading by further panning or zooming before a previous loading session has completed. Checking for greater than 100% covers us in this scenario.
Within the conditional block, we know that all the tiles have loaded. We reset the progress bar so that it's hidden, has a new starting width of 0, and the tile tracking variables are put back to their original starting value of 0. We wrap this reset within a setTimeout JavaScript method because the progress bar width animates into the new position. So, this gives the animation a chance to complete to 100% before hiding it from the map:
rasterSource.on('tileloadstart', function() {
  progressBar.parentNode.style.opacity = 1;
  ++tilesPending;
});
On the contrary, we subscribe to the event that's published when a tile load is initiated. Our handler ensures the progress bar is visible (as there's at least one tile to load) and increments the amount of tiles pending.