Table of Contents for
OpenLayers 3.x Cookbook - Second Edition
 OpenLayers 3.x Cookbook - Second Edition
Published by
Packt Publishing, 2016
OpenLayers 3.x Cookbook - Second Edition
Published by
Packt Publishing, 2016
- Cover
- Table of Contents
- OpenLayers 3.x Cookbook Second Edition
- OpenLayers 3.x Cookbook Second Edition
- Credits
- About the Authors
- About the Reviewer
- www.PacktPub.com
- Preface
- What you need for this book
- Who this book is for
- Sections
- Conventions
- Reader feedback
- Customer support
- 1. Web Mapping Basics
- Creating a simple fullscreen map
- Playing with the map's options
- Managing the map's stack layers
- Managing the map's controls
- Moving around the map view
- Restricting the map's extent
- 2. Adding Raster Layers
- Using Bing imagery
- Using OpenStreetMap imagery
- Adding WMS layers
- Changing the zoom effect
- Changing layer opacity
- Buffering the layer data to improve map navigation
- Creating an image layer
- Setting the tile size in WMS layers
- 3. Working with Vector Layers
- Adding a GML layer
- Adding a KML layer
- Creating features programmatically
- Exporting features as GeoJSON
- Reading and creating features from a WKT
- Using point features as markers
- Removing or cloning features using overlays
- Zooming to the extent of a layer
- Adding text labels to geometry points
- Adding features from a WFS server
- Using the cluster strategy
- Reading features directly using AJAX
- Creating a heat map
- 4. Working with Events
- Creating a side-by-side map comparator
- Implementing a work-in-progress indicator for map layers
- Listening for the vector layer features' events
- Listening for mouse or touch events
- Using the keyboard to pan or zoom
- 5. Adding Controls
- Adding and removing controls
- Working with geolocation
- Placing controls outside the map
- Drawing features across multiple vector layers
- Modifying features
- Measuring distances and areas
- Getting feature information from a data source
- Getting information from a WMS server
- 6. Styling Features
- Styling layers
- Styling features based on geometry type
- Styling based on feature attributes
- Styling interaction render intents
- Styling clustered features
- 7. Beyond the Basics
- Working with projections
- Creating a custom control
- Selecting features by dragging out a selection area
- Transitioning between weather forecast imagery
- Using the custom OpenLayers library build
- Drawing in freehand mode
- Modifying layer appearance
- Adding features to the vector layer by dragging and dropping them
- Making use of map permalinks
- Index
The ability to measure distances or areas is an important feature for many GIS applications. For example, a user may wish to draw out a path along some roads to figure out the distance of a journey. Or you may want to draw a polygon around your neighbor's back garden to see how many acres they have!
OpenLayers 2 conveniently came with a measuring control straight out of the box. However, at the time of writing this book, OpenLayers 3 doesn't offer this convenience. However, you'll be pleased to know that this can be cobbled together with the methods that are available to us without much fuss.
The application will contain a sidebar with radio inputs in order to select a measurement type, either area or distance. The user will be able to draw anywhere on the map and see a live update of the measurement in the sidebar as they go. For mobile, the updates will be seen after every new point has been placed on the map.
The source code can be found in ch05/ch05-measuring, and this will look like the following screenshot:
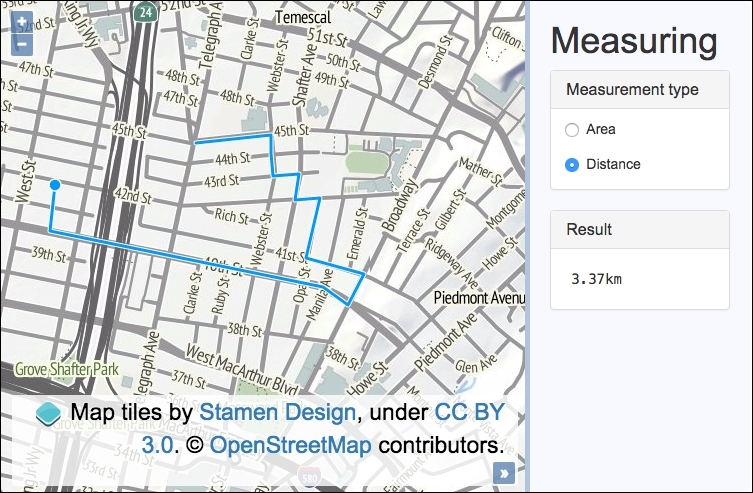
To see a live demonstration of this recipe, visit https://jsfiddle.net/pjlangley/Ln8wz7ty/.
To create a measuring tool for distances and areas, use the following instructions:
- Create an HTML file and add the OpenLayers dependencies, the jQuery library, and
divto hold the map. In particular, add the following essential markup that we'll be interacting with in the JavaScript:<form> <label> <input type="radio" name="measurement" value="Polygon" checked> Area </label> <label> <input type="radio" name="measurement" value="LineString"> Distance </label> </form> <samp id="js-result">n/a</samp> - Create a custom JavaScript file and store a vector layer with
sourcein a variable, and also instantiatemapwithviewandlayers:var vectorLayer = new ol.layer.Vector({ source: new ol.source.Vector() }); var map = new ol.Map({ view: new ol.View({ zoom: 15, center: [-13610530, 4555374] }), target: 'js-map', layers: [ new ol.layer.Tile({ source: new ol.source.Stamen({ layer: 'terrain' })}), vectorLayer ] }); - Cache some DOM elements and set up a global variable to hold the reference of the measuring tool:
var measurementRadios = $('[type=radio]'); var resultElement = $('#js-result'); var measuringTool; - Implement the method to enable the measuring tool:
var enableMeasuringTool = function() { map.removeInteraction(measuringTool); var geometryType = measurementRadios.filter(':checked').val(); var html = geometryType === 'Polygon' ? '<sup>2</sup>' : ''; measuringTool = new ol.interaction.Draw({ type: geometryType, source: vectorLayer.getSource() }); measuringTool.on('drawstart', function(event) { vectorLayer.getSource().clear(); event.feature.on('change', function(event) { var measurement = geometryType === 'Polygon' ? event.target.getGeometry().getArea() : event.target.getGeometry().getLength(); var measurementFormatted = measurement > 100 ? (measurement / 1000).toFixed(2) + 'km' : measurement.toFixed(2) + 'm'; resultElement.html(measurementFormatted + html); }); }); map.addInteraction(measuringTool); }; - Subscribe to the
changeevent on theradioinputs with a handler to update the measuring control. Finally, enable the measuring tool by default:measurementRadios.on('change', enableMeasuringTool); enableMeasuringTool();
We've omitted much of the HTML and all the CSS for brevity. For a complete look at how the styling and structure is achieved, please view the source code, where you'll see our use of the Bootstrap CSS framework.
Let's dive into the core of this recipe where we build the measuring control:
var enableMeasuringTool = function() {
  map.removeInteraction(measuringTool);
When this method is called, it's sourced from either a change in the radio input selection or at page load. We want to ensure that the measuring tool (draw interaction) is set up with the correct configuration, so the old copy (if it exists) is removed from the map first.
var geometryType = measurementRadios.filter(':checked').val();
var html = geometryType === 'Polygon' ? '<sup>2</sup>' : '';
Next, we store a reference of the geometry type. The filter jQuery method is used to identify the checked radio input, and the val jQuery method extracts the value.
The html variable is what we append onto the measurement result in the sidebar. If this is of type Polygon, then it's an area measurement and, so, we add 2 to represent squared; otherwise, it's set to an empty string. We've used a ternary operator to conditionally assign a value to a variable, a technique that we used throughout this recipe.
  measuringTool = new ol.interaction.Draw({
    type: geometryType,
    source: vectorLayer.getSource()
  });
As you can see, our custom measuring tool is simply an instance of the draw interaction behind the scenes. The type property is assigned the geometry type, accordingly.
measuringTool.on('drawstart', function(event) {
  vectorLayer.getSource().clear();
We subscribe to the drawstart event that's emitted from the draw interaction. When the user places the first point of their drawing on the map, we clear the vector source of any existing features with the clear method.
event.feature.on('change', function(event) {When a feature's geometry changes, it publishes a change event that we can subscribe to on the ol.Feature instance. This means that we can update the sidebar with the latest measurement while the user is still drawing. Potentially, this event can be fired at a high frequency, so you could consider a throttling technique here for performance (refer to https://remysharp.com/2010/07/21/throttling-function-calls for more details).
    var measurement = geometryType === 'Polygon'
      ? event.target.getGeometry().getArea()
      : event.target.getGeometry().getLength();
Within the geometry change event, we use the event target (an instance of ol.Feature) to retrieve the latest geometry. If it's a Polygon drawing interaction, then we want to calculate the area. The ol.geom.Polygon class has the getArea method for this. Alternatively, ol.geom.LineString has the getLength method to provide the distance. The result is stored in the measurement variable.
      var measurementFormatted = measurement > 100
        ? (measurement / 1000).toFixed(2) + 'km'
        : measurement.toFixed(2) + 'm';
As a default, the measurement is provided in meters by OpenLayers. In the case where the measurement exceeds 100 meters, we convert it to kilometers, as this is probably more useful. There are 1000 meters in a kilometer, so for example, if we have 200 meters, 200 divided by 1000 = 0.2 kilometers. We also round the value to two decimal places with the toFixed JavaScript method. The units of measurement is concatenated on to the end of the number.
      resultElement.html(measurementFormatted + html);
    });
  });
  map.addInteraction(measuringTool);
Finally, the sidebar element which displays the measurement is populated with the formatted version and concatenated with the contents of the html variable (which could contain a 2 for area or a blank string for distance) via the jQuery html method. The last part of this function adds the completed interaction to the map.
The calculations for the measurements are represented in a simple projected plane without the Earth's curvature taken into account. A more involved geodesic calculation can be achieved through OpenLayers, but this is a bit more advanced and won't be covered in this recipe.
This official example from OpenLayers demonstrates how to provide measurements in geodesic metrics at http://openlayers.org/en/v3.13.1/examples/measure.html. Microsoft also has an interesting article on the topic at https://msdn.microsoft.com/en-GB/library/aa940990.aspx.