Table of Contents for
OpenLayers 3.x Cookbook - Second Edition
 OpenLayers 3.x Cookbook - Second Edition
Published by
Packt Publishing, 2016
OpenLayers 3.x Cookbook - Second Edition
Published by
Packt Publishing, 2016
- Cover
- Table of Contents
- OpenLayers 3.x Cookbook Second Edition
- OpenLayers 3.x Cookbook Second Edition
- Credits
- About the Authors
- About the Reviewer
- www.PacktPub.com
- Preface
- What you need for this book
- Who this book is for
- Sections
- Conventions
- Reader feedback
- Customer support
- 1. Web Mapping Basics
- Creating a simple fullscreen map
- Playing with the map's options
- Managing the map's stack layers
- Managing the map's controls
- Moving around the map view
- Restricting the map's extent
- 2. Adding Raster Layers
- Using Bing imagery
- Using OpenStreetMap imagery
- Adding WMS layers
- Changing the zoom effect
- Changing layer opacity
- Buffering the layer data to improve map navigation
- Creating an image layer
- Setting the tile size in WMS layers
- 3. Working with Vector Layers
- Adding a GML layer
- Adding a KML layer
- Creating features programmatically
- Exporting features as GeoJSON
- Reading and creating features from a WKT
- Using point features as markers
- Removing or cloning features using overlays
- Zooming to the extent of a layer
- Adding text labels to geometry points
- Adding features from a WFS server
- Using the cluster strategy
- Reading features directly using AJAX
- Creating a heat map
- 4. Working with Events
- Creating a side-by-side map comparator
- Implementing a work-in-progress indicator for map layers
- Listening for the vector layer features' events
- Listening for mouse or touch events
- Using the keyboard to pan or zoom
- 5. Adding Controls
- Adding and removing controls
- Working with geolocation
- Placing controls outside the map
- Drawing features across multiple vector layers
- Modifying features
- Measuring distances and areas
- Getting feature information from a data source
- Getting information from a WMS server
- 6. Styling Features
- Styling layers
- Styling features based on geometry type
- Styling based on feature attributes
- Styling interaction render intents
- Styling clustered features
- 7. Beyond the Basics
- Working with projections
- Creating a custom control
- Selecting features by dragging out a selection area
- Transitioning between weather forecast imagery
- Using the custom OpenLayers library build
- Drawing in freehand mode
- Modifying layer appearance
- Adding features to the vector layer by dragging and dropping them
- Making use of map permalinks
- Index
When working with geographic information, its geometrical representation in space is not the only important thing. There's also the dimension of time that we can take into account. People are increasingly interested in up-to-date information or data based around particular moments in time.
This way, visualizations can show us how data changes over time: city population, disease outbreaks, weather forecasts, and so on.
In this recipe, we're going to show you how we can create an animation on the client side by transitioning between weather forecasts at different times of the day.
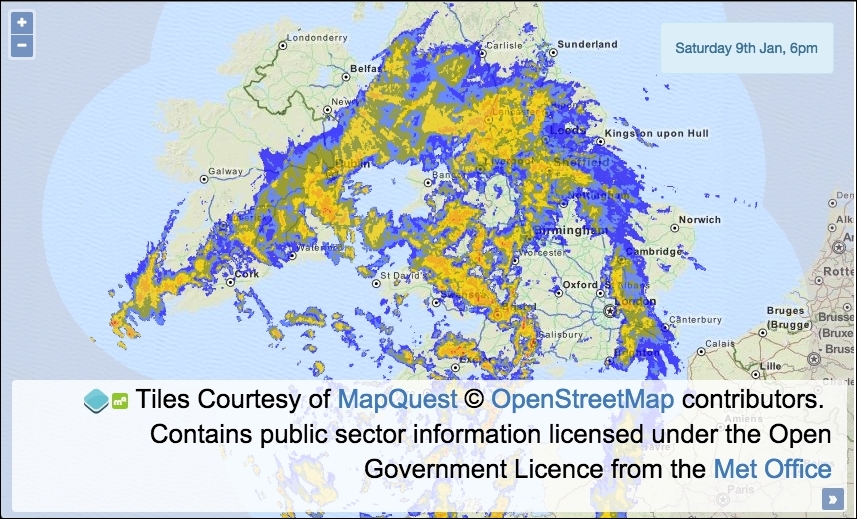
We're going to use a WMTS service from the Met Office (http://www.metoffice.gov.uk), showing the rain evolution at different time instants (as shown in the following screenshot), and we will create an animation by making the previous forecast fade away and the new one fade in. The time of day that the visualization represents will be displayed at the top-right of the map.
The source code can be found in ch07/ch07-weather-forecast-imagery.
During this recipe, we will work with dates in JavaScript in order to request data at specific times. To help with this and also to assist in formatting times into strings for display, we've used a very good library that is specifically designed for this type of manipulation, which is called moment, and it can be downloaded from http://momentjs.com.
We will be connecting to a WMTS service from the Met Office (http://www.metoffice.gov.uk/datapoint/support/documentation/inspire-layers-detailed-documentation) that requires an API key for usage, just like we saw with Bing Maps in the Using Bing imagery recipe in Chapter 2, Adding Raster Layers. Go and register (for free) at http://www.metoffice.gov.uk/datapoint; on registration, you'll be able to attain your API key. It's a very quick and automated process.
- Create a new HTML file and add the OpenLayers dependencies and also add the JavaScript date library,
moment, as discussed in the Getting ready section of this recipe. Add adivelement to hold the map, and in particular, some markup to display the time:<span id="js-time"></span>
- Create a custom JavaScript file and manually generate
resolutionsper zoom level based on theEPSG:4326projection:var proj4326 = ol.proj.get('EPSG:4326'); var proj4326Extent = proj4326.getExtent(); var size = ol.extent.getWidth(proj4326Extent) / 256; var resolutions = [], matrixIds = []; for (var z = 0; z < 11; ++z) { resolutions[z] = size / Math.pow(2, z); matrixIds[z] = z; } - Produce a list of times, starting from the last hour and going back five hours from now:
var times = [], count = 0; while (count <= 5) { var time = moment().startOf('hour'); time.subtract(count, 'hour'); times.push(time); count++; } - Assign your API key to this variable (refer to the Getting ready section of this recipe for more details):
var apiKey = 'YOUR_API_KEY_HERE';
- Create a function that'll return a new instance of our WMTS layer:
var createWMTSLayer = function(time) { return new ol.layer.Tile({ opacity: 0.7, source: new ol.source.WMTS({ attributions: [new ol.Attribution({ html: '<br>Contains public sector information licensed' + 'under the Open Government Licence from the ' + '<a href="http://www.metoffice.gov.uk">Met Office</a>' })], url:'http://datapoint.metoffice.gov.uk/' + 'public/data/inspire/view/wmts?' + 'key=' + apiKey + '&TileMatrix=EPSG:4326:6&' + 'time=' + time.format('YYYY-MM-DDTHH:00:00') + 'Z', layer: 'RADAR_UK_Composite_Highres', matrixSet: 'EPSG:4326', format: 'image/png', style: 'Bitmap 1km Blue-Pale blue gradient 0.01 to 32mm/hr', projection: proj4326, tileGrid: new ol.tilegrid.WMTS({ origin: ol.extent.getTopLeft(proj4326Extent), resolutions: resolutions, matrixIds: matrixIds }) }) }); }; - Instantiate a new
mapinstance with aviewinstance that is restricted to zoom level 6 and a raster tile layer for the background mapping. CallcreateWMTSLayerin order to add the weather forecast layer based on the first time in the list:var map = new ol.Map({ view: new ol.View({ zoom: 6, minZoom: 6, maxZoom: 6, center: [-354667, 7254791]}), target: 'js-map', layers: [ new ol.layer.Tile({source: new ol.source.MapQuest({ layer: 'osm' })}), createWMTSLayer(times[0])] }); - Cache the DOM element that holds the time representing the currently visible data on the map. Add the first time from the list to the element:
var timeElem = document.getElementById('js-time'); timeElem.innerHTML = times[0].format('dddd Do MMM, ha'); - Set up some variables that'll be used during the forecast transitioning process:
var rotateCount = 1, oldLayer, newLayer;
- Create the function that'll make the previous weather forecast imagery fade out and remove it:
var fadeAndRemoveLayer = function() { var opacity = oldLayer.getOpacity(); if (opacity > 0) { oldLayer.setOpacity(opacity - 0.1); setTimeout(fadeAndRemoveLayer, 100); } else { map.removeLayer(oldLayer); timeElem.innerHTML = times[rotateCount].format( 'dddd Do MMM, ha' ); if (rotateCount !== times.length - 1) { rotateCount++; } else { rotateCount = 0; } setTimeout(rotate, 7000); } }; - Create the function that'll make the new weather forecast imagery fade in:
var showLayer = function() { var opacity = newLayer.getOpacity(); if (opacity < 0.7) { newLayer.setOpacity(opacity + 0.1); setTimeout(showLayer, 100); } }; - Create the function that'll
rotatethe weather forecast imagery:var rotate = function() { newLayer = createWMTSLayer(times[rotateCount]); newLayer.setOpacity(0); map.addLayer(newLayer); oldLayer = map.getLayers().item(1); setTimeout(function() { fadeAndRemoveLayer(); showLayer(); }, 3000); }; - Finally, schedule the weather forecast imagery to begin transitioning in 10 seconds:
setTimeout(rotate, 10000);
As you can see, there's a lot of code to cover here. We won't go into any details about how the HTML and CSS is implemented, but please view the book source code to find out more. We're going to focus on the newly introduced concepts of the JavaScript:
var proj4326 = ol.proj.get('EPSG:4326');
var proj4326Extent = proj4326.getExtent();
var size = ol.extent.getWidth(proj4326Extent) / 256;
var resolutions = [], matrixIds = [];
for (var z = 0; z < 11; ++z) {
  resolutions[z] = size / Math.pow(2, z);
  matrixIds[z] = z;
}When we use this WMTS service, we need to manually set up the resolution for each zoom level based on the capabilities of the service, which you can discover at http://datapoint.metoffice.gov.uk/public/data/inspire/view/wmts?REQUEST=getcapabilities&key=YOUR_API_KEY_HERE. As you can see, your API key forms part of the URL, so make sure to add it in.
The WMTS service supports the EPSG:4326 projection, which as we know, OpenLayers supports by default, so this makes the implementation a bit easier.
From the retrieval of the projection's extent (proj4326.getExtent()), we can divide this by 256 (the pixel width of a tile). The next task is to assign a resolution based on the size for each zoom level (this WMTS service supports 11 zoom levels, starting from 0). On each iteration of the loop, the relevant resolution is applied to that zoom level.
If the zoom level is 7, the base number 2 is raised by the exponent of 7 (Math.pow(2, 7)). In other words, 2*2*2*2*2*2*2. This equals 128, which the size of the zoom level divides by, giving a resolution of 0.010986328125 for this matrix ID of 7.
This information is used when we set up the tile grid for the WMTS source. We demonstrated a similar tile grid construction for the Setting the tile size in WMS layers recipe in Chapter 2, Adding Raster Layers.
var times = [], count = 0;
while (count <= 5) {
  var time = moment().startOf('hour');
  time.subtract(count, 'hour');
  times.push(time);
  count++;
}We collect six timestamps that will form part of the WMTS service request. The service usually provides data in 15-minute intervals, backing up until midnight of the previous day. However, we have decided to collect data hourly. The moment library allows us to conveniently start from the beginning of the last hour (moment().startOf('hour')). For example, if the current time is 3:28 p.m., the list will begin with a timestamp of 3:00 p.m. and finish with a final time entry of 10:00 a.m. The moment method, subtract, uses the count value (incremented on each iteration) to subtract the relevant number of hours from the starting hour.
var createWMTSLayer = function(time) {
return new ol.layer.Tile({
opacity: 0.7,
source: new ol.source.WMTS({
...
url: 'http://datapoint.metoffice.gov.uk/' +
'public/data/inspire/view/wmts?' +
'key=' + apiKey + '&TileMatrix=EPSG:4326:6&' +
'time=' + time.format('YYYY-MM-DDTHH:00:00') + 'Z',
layer: 'RADAR_UK_Composite_Highres',
matrixSet: 'EPSG:4326',
format: 'image/png',
style: 'Bitmap 1km Blue-Pale blue gradient 0.01 to 32mm/hr',
projection: proj4326,
tileGrid: new ol.tilegrid.WMTS({
origin: ol.extent.getTopLeft(proj4326Extent),
resolutions: resolutions,
matrixIds: matrixIds
})
})
});
};For brevity, we haven't included the entire code for this method, as we don't need to explain every part of it at this stage in the book.
Our createWMTSLayer function takes one parameter, time. This is because the URL is partly formed from time so that we can fetch the weather forecast for a specific time. You'll see that, within the value for the url property, we format the time into a string (time.format('YYYY-MM-DDTHH:00:00') + 'Z') using the moment library, which is the structure required by the WMTS service; for example, 2016-04-15T11:00:00Z.
The url property doesn't contain the entirety of the URL, as the other properties layer, matrixSet, format, and style, are also combined in the URL string by OpenLayers. If we wanted to, we could have added these key/values to the URL string ourselves and avoided extra properties.
The tileGrid property is assigned a new instance of ol.tilegrid.WMTS, which sets up the grid pattern for us. This means that a tile can be correctly requested from the WMTS service with the relevant matrix details, such as the tile column and tile row, which are added to the URL as TileCol=66&TileRow=13, for example.
You can see that our resolutions and matrix IDs are used to structure the tile grid that OpenLayers creates for us via the resolutions and matrixIds properties, respectively.
var fadeAndRemoveLayer = function() {
var opacity = oldLayer.getOpacity();
if (opacity > 0) {
oldLayer.setOpacity(opacity - 0.1);
setTimeout(fadeAndRemoveLayer, 100);
} else {
map.removeLayer(oldLayer);
timeElem.innerHTML = times[rotateCount].format('dddd Do MMM, ha');
if (rotateCount !== times.length - 1) {
rotateCount++;
} else {
rotateCount = 0;
}
setTimeout(rotate, 7000);
}
};This method gracefully makes the old WMTS layer fade away and then removes it from the map. It begins by retrieving the latest opacity value of the layer and checks to see whether it's above 0. If this is the case, this infers that it's still visible; so, we take away another 0.1 from the opacity level (further making this fade out) and call this function again in 100 milliseconds using the JavaScript setTimeout method.
When opacity isn't greater than 0 anymore, we remove the old WMTS layer from the map. We then update the HTML time display to the new time and format it accordingly. The time is gathered from the list of times, which are based on the value inside the rotateCount variable. We keep the rotateCount variable up-to-date within the preceding conditional block.
If rotateCount is still less than the last index of the list of times, we increment the value, as it infers that we've not transitioned every time entry yet. On the contrary, if rotateCount is equal to the last index, then we reset the value to zero so that we cycle from the beginning of the list again. It's an infinite loop of the time entries.
We finish off by scheduling the next rotation to start in 7 seconds, with setTimeout(rotate, 7000).
var showLayer = function() {
  var opacity = newLayer.getOpacity();
  if (opacity < 0.7) {
    newLayer.setOpacity(opacity + 0.1);
    setTimeout(showLayer, 100);
  }
};On the flip side, to fade and remove, this function makes the new weather forecast imagery fade in. Following a similar logic, but reversed, we get the latest opacity value and check to see whether it's below 0.7 (this is the final opacity level that we wish to achieve). If it's lower than this, then we increase it by 0.1 and call this function again in 100 milliseconds. This continues until the layer has gracefully faded into view at the desired opacity value.
var rotate = function() {
  newLayer = createWMTSLayer(times[rotateCount]);
  newLayer.setOpacity(0);
  map.addLayer(newLayer);
  oldLayer = map.getLayers().item(1);
  setTimeout(function() {
    fadeAndRemoveLayer();
    showLayer();
  }, 3000);
};The rotate function, which gets kicked off in 10 seconds when the application first loads, coordinates the transitioning between forecast imagery.
This first creates the new WMTS layer, which is based on the next time entry in the list. The reference to the new layer is stored in the newLayer variable, which is how the showLayer animation method has access to it. The opacity of the layer is set to zero and then added to the map. We do this because setting the opacity to zero doesn't prevent the tiles from being requested and loaded in the map, they just won't be visible yet.
The current layer (which has to be removed) is stored in the oldLayer variable, which is how the fadeAndRemoveLayer gains access to it. The 'old' layer is always the second item in the ol.Collection array of map layers, so we can access it via item(1).
The final instruction for this method triggers the transitioning of the layers in 3 seconds time. We delay it by an arbitrary amount in order to give the new tiles a chance to load before making them fade in.