Table of Contents for
OpenLayers 3.x Cookbook - Second Edition
 OpenLayers 3.x Cookbook - Second Edition
Published by
Packt Publishing, 2016
OpenLayers 3.x Cookbook - Second Edition
Published by
Packt Publishing, 2016
- Cover
- Table of Contents
- OpenLayers 3.x Cookbook Second Edition
- OpenLayers 3.x Cookbook Second Edition
- Credits
- About the Authors
- About the Reviewer
- www.PacktPub.com
- Preface
- What you need for this book
- Who this book is for
- Sections
- Conventions
- Reader feedback
- Customer support
- 1. Web Mapping Basics
- Creating a simple fullscreen map
- Playing with the map's options
- Managing the map's stack layers
- Managing the map's controls
- Moving around the map view
- Restricting the map's extent
- 2. Adding Raster Layers
- Using Bing imagery
- Using OpenStreetMap imagery
- Adding WMS layers
- Changing the zoom effect
- Changing layer opacity
- Buffering the layer data to improve map navigation
- Creating an image layer
- Setting the tile size in WMS layers
- 3. Working with Vector Layers
- Adding a GML layer
- Adding a KML layer
- Creating features programmatically
- Exporting features as GeoJSON
- Reading and creating features from a WKT
- Using point features as markers
- Removing or cloning features using overlays
- Zooming to the extent of a layer
- Adding text labels to geometry points
- Adding features from a WFS server
- Using the cluster strategy
- Reading features directly using AJAX
- Creating a heat map
- 4. Working with Events
- Creating a side-by-side map comparator
- Implementing a work-in-progress indicator for map layers
- Listening for the vector layer features' events
- Listening for mouse or touch events
- Using the keyboard to pan or zoom
- 5. Adding Controls
- Adding and removing controls
- Working with geolocation
- Placing controls outside the map
- Drawing features across multiple vector layers
- Modifying features
- Measuring distances and areas
- Getting feature information from a data source
- Getting information from a WMS server
- 6. Styling Features
- Styling layers
- Styling features based on geometry type
- Styling based on feature attributes
- Styling interaction render intents
- Styling clustered features
- 7. Beyond the Basics
- Working with projections
- Creating a custom control
- Selecting features by dragging out a selection area
- Transitioning between weather forecast imagery
- Using the custom OpenLayers library build
- Drawing in freehand mode
- Modifying layer appearance
- Adding features to the vector layer by dragging and dropping them
- Making use of map permalinks
- Index
We showed you how to draw features back in Chapter 5, Adding Controls in the Drawing features across multiple vector layers recipe. OpenLayers also offers a freehand mechanism to draw features on vector layers using the ol.interaction.Draw class. Freehand mode can be defined as sketching something over the map without the defined accuracy and direction that you get when drawing a geometry type without freehand mode.
Having the flexibility to draw with more freedom can be useful in many application requirements. For example, it may be less arduous to create a path along a road with the continuous drawing flow of freehand, rather than having to click to add a point each time on the road as you go. With freehand mode, points are automatically added for you as you move the mouse in the direction that you want to draw in.
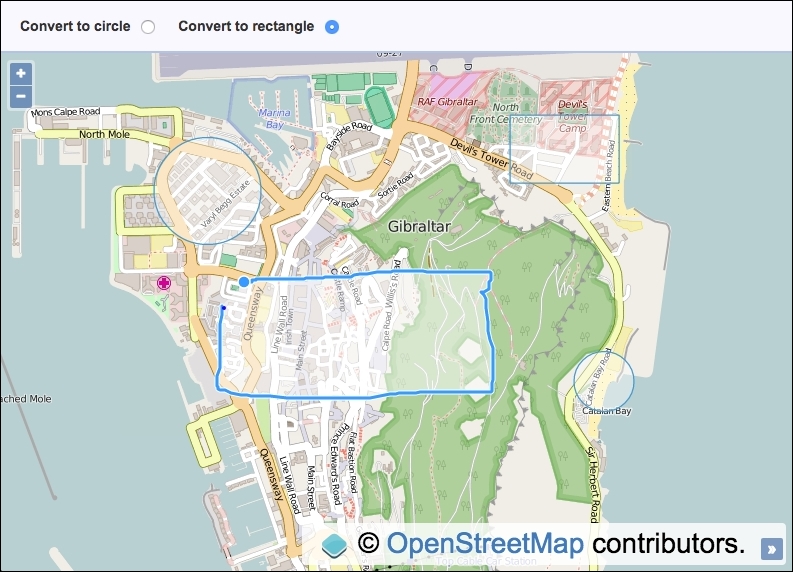
OpenLayers supports the freehand drawing of either polygons or lines. In this recipe, we're going to explore drawing polygons in freehand mode. After a polygon has been sketched, we will convert it to a more regular looking shape, either to a circle or a rectangle, based on what the user has selected from the radio inputs (refer to the following screenshot).
By default, the drawing freehand mode is enabled by holding down the Shift key, then keeping the mouse button pressed, and moving the cursor. When you're finished, release the Shift key and single click to complete the drawing. We'll use these defaults in our recipe.
The source code can be found in ch07/ch07-freehand-drawing, and we'll end up with something that looks like the following screenshot:
- Create an HTML file and include the OpenLayers dependencies and a
divelement to hold the map. In particular, have the following HTML for theradioinputs:<input type="radio" name="convert" value="circle"> <input type="radio" name="convert" value="rectangle" checked>
- Create a custom JavaScript file and instantiate a
mapinstance with aviewinstance, a raster layer, and also a vector layer:var map = new ol.Map({ view: new ol.View({ zoom: 15, center: [-595501, 4320196] }), target: 'js-map', layers: [ new ol.layer.Tile({source: new ol.source.OSM()}), new ol.layer.Vector({source: new ol.source.Vector()}) ] }); - Set up the
drawinteraction for the polygon geometry type and add it to themapinstance:var draw = new ol.interaction.Draw({ source: map.getLayers().item(1).getSource(), type: 'Polygon' }); map.addInteraction(draw); - Subscribe to the
drawendevent and convert the sketch to either arectangleor acirclegeometry:draw.on('drawend', function(event) { var feature = event.feature; var convertTo = document.querySelector('[type="radio"]:checked').value; if (convertTo === 'rectangle') { feature.setGeometry( new ol.geom.Polygon.fromExtent( feature.getGeometry().getExtent() ) ); } else { var extent = feature.getGeometry().getExtent(); var centre = ol.extent.getCenter(extent); var width = ol.extent.getTopRight(extent)[0] - ol.extent.getTopLeft(extent)[0]; var radius = width / 2; feature.setGeometry( new ol.geom.Circle(centre, radius) ); } });
We've used the Bootstrap CSS framework to help style the top panel content, which we've excluded in the How to do it… section of this recipe. Please view the source code for the complete picture.
Most of the code will look similar to you from previous recipes, but we'll of course take a closer look at what's going on within the event hander for the draw interaction:
draw.on('drawend', function(event) {
  var feature = event.feature;
  var convertTo =
      document.querySelector('[type="radio"]:checked').value;
Once a freehand sketch has been completed, the drawend event is published, which our preceding handler subscribes to.
The event object holds reference to the drawn feature, which we store in a variable, namely feature. We store the user's conversion choice in the convertTo variable by querying the DOM for the radio input that's been selected, and then we retrieve the value of the input element. The value will either be 'rectangle' or 'circle'.
if (convertTo === 'rectangle') {
    feature.setGeometry(
      new ol.geom.Polygon.fromExtent(
        feature.getGeometry().getExtent()
      )
    );
If the user has selected this drawing to convert it to a rectangle, we update the geometry of the feature in place, using the setGeometry method from the ol.Feature instance. Inside this method, we provide a new geometry instance.
To create a new geometry instance from the extent of the sketched out feature, we use the helpful method, ol.geom.Polygon.fromExtent. This method takes a single parameter of the extent and returns an instance of ol.geom.Polygon, which is used as the replacement geometry for the feature.
var extent = feature.getGeometry().getExtent();
var centre = ol.extent.getCenter(extent);
var width = ol.extent.getTopRight(extent)[0] -
    ol.extent.getTopLeft(extent)[0];
var radius = width / 2;

feature.setGeometry(
  new ol.geom.Circle(centre, radius)
);
However, if the user wants to convert the sketch to a circle, we have a little more manual work to do.
We begin by retrieving the extent of the geometry in the same way as before. With extent, we can estimate what an accurate circle should be from the intention of the sketch. OpenLayers provides a bunch of methods that can be used when working with extents as a part of the ol.extent object.
The first of this is the self-explanatory ol.extent.getCenter method. The centre coordinate that is returned from this method will also be used to define the centre coordinate of our circle.
We then calculate the width of extent by taking the right-most point with the ol.extent.getTopRight method and subtracting it from the left-most point with the ol.extent.getTopLeft method. If we wanted to, we could have alternatively used the ol.extent.getBottomRight and ol.extent.getBottomLeft methods to provide the same desired result.
Both of these methods return a coordinate, an array of the ol.Coordinate type in the xy format. We're only interested in width, so we take the x values from each array by accessing the first index ([0]). The result, which is stored in the width variable, essentially provides the diameter for our circle.
When we construct a circle geometry, using the ol.geom.Circle constructor, the second argument expects a radius circle, not diameter, so we divide the width variable by two.
We finish by setting the new geometry on the feature in place, just like we did before.
Note
If you're looking to achieve similar functionality in OpenLayers 2, there's a tutorial at http://codechewing.com/library/create-circles-in-openlayers-using-freehand-mode/.