Table of Contents for
OpenLayers 3.x Cookbook - Second Edition
 OpenLayers 3.x Cookbook - Second Edition
Published by
Packt Publishing, 2016
OpenLayers 3.x Cookbook - Second Edition
Published by
Packt Publishing, 2016
- Cover
- Table of Contents
- OpenLayers 3.x Cookbook Second Edition
- OpenLayers 3.x Cookbook Second Edition
- Credits
- About the Authors
- About the Reviewer
- www.PacktPub.com
- Preface
- What you need for this book
- Who this book is for
- Sections
- Conventions
- Reader feedback
- Customer support
- 1. Web Mapping Basics
- Creating a simple fullscreen map
- Playing with the map's options
- Managing the map's stack layers
- Managing the map's controls
- Moving around the map view
- Restricting the map's extent
- 2. Adding Raster Layers
- Using Bing imagery
- Using OpenStreetMap imagery
- Adding WMS layers
- Changing the zoom effect
- Changing layer opacity
- Buffering the layer data to improve map navigation
- Creating an image layer
- Setting the tile size in WMS layers
- 3. Working with Vector Layers
- Adding a GML layer
- Adding a KML layer
- Creating features programmatically
- Exporting features as GeoJSON
- Reading and creating features from a WKT
- Using point features as markers
- Removing or cloning features using overlays
- Zooming to the extent of a layer
- Adding text labels to geometry points
- Adding features from a WFS server
- Using the cluster strategy
- Reading features directly using AJAX
- Creating a heat map
- 4. Working with Events
- Creating a side-by-side map comparator
- Implementing a work-in-progress indicator for map layers
- Listening for the vector layer features' events
- Listening for mouse or touch events
- Using the keyboard to pan or zoom
- 5. Adding Controls
- Adding and removing controls
- Working with geolocation
- Placing controls outside the map
- Drawing features across multiple vector layers
- Modifying features
- Measuring distances and areas
- Getting feature information from a data source
- Getting information from a WMS server
- 6. Styling Features
- Styling layers
- Styling features based on geometry type
- Styling based on feature attributes
- Styling interaction render intents
- Styling clustered features
- 7. Beyond the Basics
- Working with projections
- Creating a custom control
- Selecting features by dragging out a selection area
- Transitioning between weather forecast imagery
- Using the custom OpenLayers library build
- Drawing in freehand mode
- Modifying layer appearance
- Adding features to the vector layer by dragging and dropping them
- Making use of map permalinks
- Index
So far, in this chapter, we've looked at how to respond to events that OpenLayers itself publishes, such as tile load events and vector feature events, such as feature added. However, what about user-driven gestures and interactions with the map? This recipe takes a look at some of these types of events.
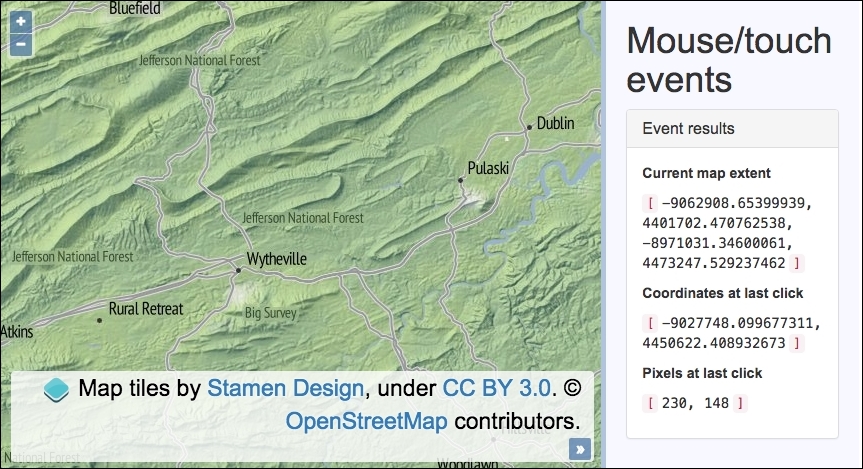
We'll demonstrate the click or tap and map panning events. When the user clicks on or touches the map, the geometry and pixel coordinates will be displayed in the sidebar. When the map is panned, the new visible extent of the map will be displayed in the sidebar as well.
The source code can be found in ch04/ch04-mouse-touch-events, and here's a screenshot of what this will look like:
To set up and subscribe to some user-driven events, follow these steps:
- Create an HTML file and include the OpenLayers dependencies. In particular, include the
divelement for the map and the markup for the side panel and content:<div id="js-map" class="map"></div> <div class="pane"> <h1>Mouse/touch events</h1> <div class="panel panel-default"> <h3 class="panel-title">Event results</h3> <div class="panel-body"> <p class="event-heading">Current map extent</p> <p> <code>[</code> <samp id ="js-extent">n/a</samp> <code>]</code> </p> <p class="event-heading">Coordinates at last click</p> <p> <code>[</code> <samp id="js-coords">n/a</samp> <code>]</code> </p> <p class="event-heading">Pixels at last click</p> <p> <code>[</code> <samp id="js-pixels">n/a</samp> <code>]</code> </p> </div> </div> </div> - Cache some DOM elements to be used for display, as follows:
var coords = document.getElementById('js-coords'); var pixels = document.getElementById('js-pixels'); var extent = document.getElementById('js-extent'); - Set up the map with a
viewand raster layer:new ol.Map({ view: new ol.View({ zoom: 10, center: [-9016970, 4437475] }), target: 'js-map', layers: [ new ol.layer.Tile({source: new ol.source.Stamen( {layer: 'terrain'} )}) ] }) - Subscribe to some map events and update the sidebar elements accordingly:
.on(['click', 'moveend'], function(event) {
  if (event.type === 'click') {
    coords.innerHTML = event.coordinate.join(',<br>');

    var pixelsAtCoords =
      event.map.getPixelFromCoordinate(event.coordinate);
    pixels.innerHTML = [
      pixelsAtCoords[0].toFixed(0),
      pixelsAtCoords[1].toFixed(0)
    ].join(', ');
  } else {
    extent.innerHTML = event.map.getView().calculateExtent(
      event.map.getSize()
    ).join(',<br>');
  }
});
We've used the CSS framework Bootstrap to style the sidebar content. Some of the HTML has been omitted for brevity, so please view the book source code for the complete implementation.
Referring to the following code section, note that after we instantiate the map, we immediately chain the on method. The map instantiation returns the map instance (of ol.Map), which enables us to carry on without storing a reference to the map in another variable.
.on(['click', 'moveend'], function(event) {
  if (event.type === 'click') {
    coords.innerHTML = event.coordinate.join(',<br>');

    var pixelsAtCoords =
      event.map.getPixelFromCoordinate(event.coordinate);
    pixels.innerHTML = [
      pixelsAtCoords[0].toFixed(0),
      pixelsAtCoords[1].toFixed(0)
    ].join(', ');
We have supplied an array of events as the first parameter to the on method, namely the click and moveend events. Due to this combined event handler, we must differentiate between the event types when the handler is called, which is why we conditionally check the event.type property before performing the relevant logic.
The event object contains the coordinates of where the map was clicked or touched within event.coordinate. This is an array of x and y coordinates that we convert into a string, which is separated by a comma and an HTML break tag using the helpful JavaScript join method. This formats the coordinates as desired, which are then added to the DOM via the JavaScript innerHTML method.
As well as the geometry coordinates, we also want the pixel coordinates of the event. The event object stores a reference to the map (event.map), for which the map object has a method that'll return the pixel coordinates from the geometry coordinates, which is called getPixelFromCoordinate. This method expects an array of type ol.Coordinates, so we pass in the event coordinates (event.coordinate) and store the ol.Pixel type array into a variable, namely pixelsAtCoords.
We finish by updating the DOM element that displays the pixel coordinates. To save manual string concatenation, we have built up a temporary array containing the pixel coordinates without any decimal places (using the toFixed JavaScript method). We also fused together the array items with a comma and space delimiter using the JavaScript join method once again.
} else {
    extent.innerHTML = event.map.getView().calculateExtent(
      event.map.getSize()
    ).join(',<br>');
  }
Within the same handler, if it's not a click event, then it must be a moveend event. This event is published when the user has finished panning the map. In order to retrieve the new extent of the visible map, we grab a reference for the view (event.map.getView) and utilize the calculateExtent view method. This method expects the size, in pixels, of the area of interest. For us, this is the whole map in sight, which is retained from the map method, getSize.
The returned extent array is converted into a string, delimited by a comma and HTML break element, and added to the applicable DOM element for display.
There are plenty more map events that are up for grabs, such as the self-explanatory events pointerdrag and pointermove. To capture double-clicks or taps, you can use dblclick, and there are also events for when the map's view is changed (change:view) and when the map's size changes (change:size). This is useful for responsive design techniques.
I recommend that you take a look at the OpenLayers documentation in your own time to familiarize yourself with what's on offer.