Table of Contents for
OpenLayers 3.x Cookbook - Second Edition
 OpenLayers 3.x Cookbook - Second Edition
Published by
Packt Publishing, 2016
OpenLayers 3.x Cookbook - Second Edition
Published by
Packt Publishing, 2016
- Cover
- Table of Contents
- OpenLayers 3.x Cookbook Second Edition
- OpenLayers 3.x Cookbook Second Edition
- Credits
- About the Authors
- About the Reviewer
- www.PacktPub.com
- Preface
- What you need for this book
- Who this book is for
- Sections
- Conventions
- Reader feedback
- Customer support
- 1. Web Mapping Basics
- Creating a simple fullscreen map
- Playing with the map's options
- Managing the map's stack layers
- Managing the map's controls
- Moving around the map view
- Restricting the map's extent
- 2. Adding Raster Layers
- Using Bing imagery
- Using OpenStreetMap imagery
- Adding WMS layers
- Changing the zoom effect
- Changing layer opacity
- Buffering the layer data to improve map navigation
- Creating an image layer
- Setting the tile size in WMS layers
- 3. Working with Vector Layers
- Adding a GML layer
- Adding a KML layer
- Creating features programmatically
- Exporting features as GeoJSON
- Reading and creating features from a WKT
- Using point features as markers
- Removing or cloning features using overlays
- Zooming to the extent of a layer
- Adding text labels to geometry points
- Adding features from a WFS server
- Using the cluster strategy
- Reading features directly using AJAX
- Creating a heat map
- 4. Working with Events
- Creating a side-by-side map comparator
- Implementing a work-in-progress indicator for map layers
- Listening for the vector layer features' events
- Listening for mouse or touch events
- Using the keyboard to pan or zoom
- 5. Adding Controls
- Adding and removing controls
- Working with geolocation
- Placing controls outside the map
- Drawing features across multiple vector layers
- Modifying features
- Measuring distances and areas
- Getting feature information from a data source
- Getting information from a WMS server
- 6. Styling Features
- Styling layers
- Styling features based on geometry type
- Styling based on feature attributes
- Styling interaction render intents
- Styling clustered features
- 7. Beyond the Basics
- Working with projections
- Creating a custom control
- Selecting features by dragging out a selection area
- Transitioning between weather forecast imagery
- Using the custom OpenLayers library build
- Drawing in freehand mode
- Modifying layer appearance
- Adding features to the vector layer by dragging and dropping them
- Making use of map permalinks
- Index
Sometimes a tiled layer, such as Bing Maps, OpenStreetMap, or from WMS services, is not what you need. You may have access to a georeferenced image or know of a server that can return an image for arbitrary extents and resolutions.
In these cases, OpenLayers offers the ol.layer.Image class that allows us to create a layer that is based on an image. For this recipe, we hook up to a WMS service that returns a single image on request for a given bounding box. The source code can be found in ch02/ch02-image-layer/.
This recipe will use the ol.source.ImageWMS source class to connect to the WMS server. However, if you have a static georeferenced image, then you should use ol.source.ImageStatic, which works in much the same way.
To create an image layer, perform the following steps:
- Create an HTML file with the OpenLayers dependencies and a
divfor the map container. - Within your custom JavaScript file, create an
extent, which will be used to center the map and restrict theextentvariable for our image layer:var extent = [-93941, 6650480, 64589, 6766970];
- Initialize the map with a tiled raster layer from Stamen, as follows:
var map = new ol.Map({ view: new ol.View({ zoom: 10, center: ol.extent.getCenter(extent) }), target: 'js-map', layers: [ new ol.layer.Tile({ source: new ol.source.Stamen({ layer: 'toner' }) }) ] }); - Create the WMS image layer and add it to the map:
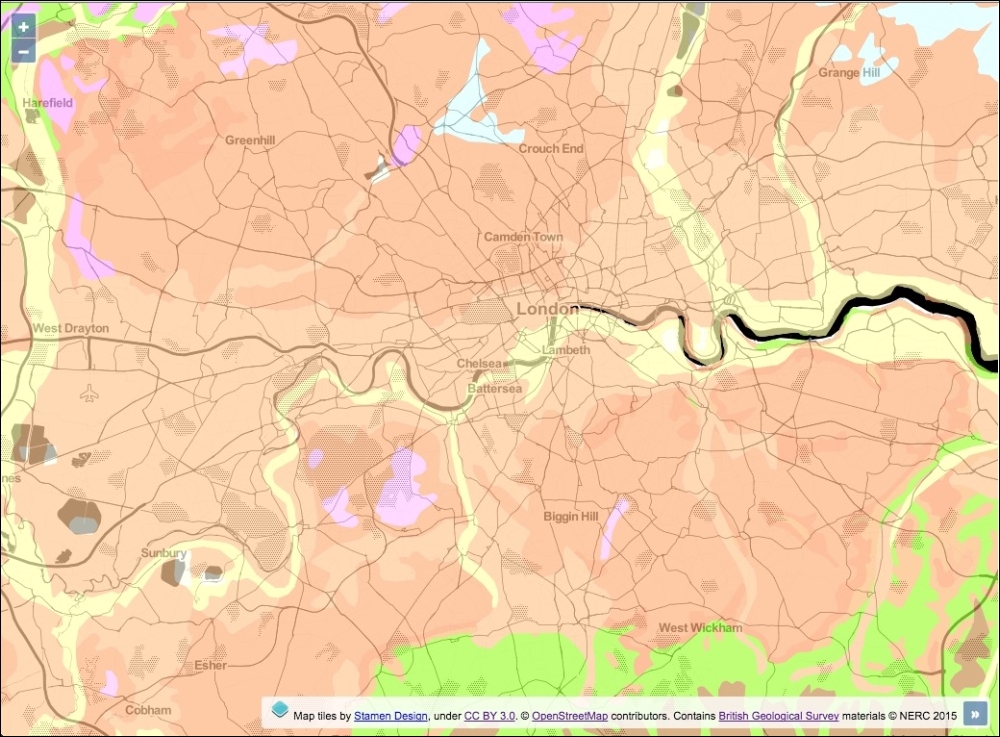
map.addLayer(new ol.layer.Image({ source: new ol.source.ImageWMS({ url: 'http://ogc.bgs.ac.uk/cgi-bin/' + 'BGS_Bedrock_and_Superficial_Geology/wms', params: { LAYERS: 'BGS_EN_Bedrock_and_Superficial_Geology' }, attributions: [ new ol.Attribution({ html: 'Contains <a href="http://bgs.ac.uk">' + 'British Geological Survey</a> ' + 'materials © NERC 2015' }) ] }), opacity: 0.7, extent: extent }));
We decided to make use of a WMS service from the British Geological Survey, which can be utilized to return a single image for specified extents of Great Britain. For the background mapping, we chose to use the Stamen provider with a layer style called toner that will provide context for the WMS image.
var extent = [-93941, 6650480, 64589, 6766970];
We store an arbitrary extent into a variable, namely extent. This extent (using the EPSG:3857 projection) covers the city of London and surrounding areas.
var map = new ol.Map({
  view: new ol.View({
    zoom: 10,
    center: ol.extent.getCenter(extent)
  })
});
When we create the map instance, the center value of the view is calculated from our custom extent. The ol.extent object provides many helper methods when working with extents, one of which is getCenter. This method expects an ol.Coordinate method (an array of coordinates), which we provide, it and returns the center coordinates for us:
map.addLayer(new ol.layer.Image({
source: new ol.source.ImageWMS({
url: 'http://ogc.bgs.ac.uk/cgi-bin/' +
'BGS_Bedrock_and_Superficial_Geology/wms',
params: {
LAYERS: 'BGS_EN_Bedrock_and_Superficial_Geology'
},
attributions: [
new ol.Attribution({
html: 'Contains <a href="http://bgs.ac.uk">' +
'British Geological Survey</a> ' +
'materials © NERC 2015'
})
]
}),
opacity: 0.7,
extent: extent
}));We create the image layer using the ol.layer.Image class. Using this class will request and return a single image, rather than multiple tile images. On the layer, we set the opacity property to 70% and restrict the extent of the layer by passing in our custom extent to the extent property.
The source property is an instance of ol.source.ImageWMS, which is similar to ol.source.TileWMS in its available properties. We provide the necessary details to successfully retrieve an image from this WMS service, such as the URL, the parameters of the request to include the specific layer that we're interested in, and the attribution to cover our usage.
OpenLayers will accompany our LAYERS parameter by sending some other parameters along with the request as default, such as FORMAT, VERSION, TRANSPARENT, and so on.
As we have restricted the extent of this layer, when you zoom to lower resolutions, this restriction becomes apparent, as demonstrated in the following screenshot:
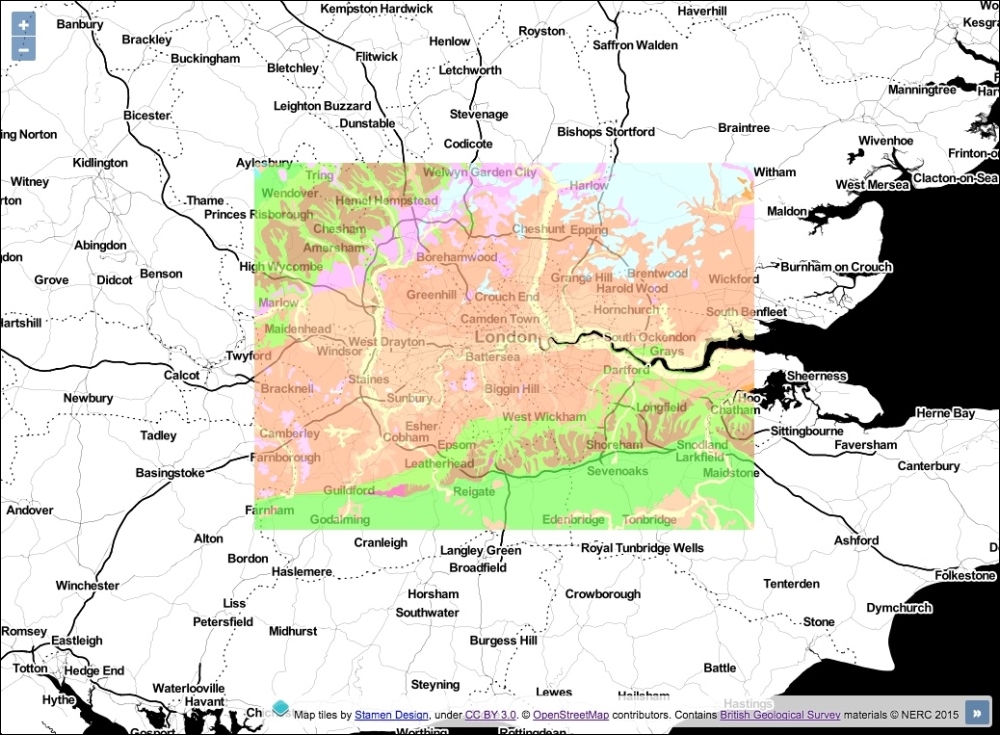
When examining the returned image in the browser development tools, it weighed over half a megabyte with dimensions (in pixels) of 1556 × 1143. Suffice to say that the time to download and render this image on the map was not instantaneous.
When compared against tile requests that begin building up the map view incrementally, the user may feel a perceived loss of responsiveness with single image layers. It's up to you how to combat this—perhaps a loading bar or spinner as a visual cue of the current progress. Chapter 4, Working with Events, has a topic on implementing a work-in-progress indicator for map layers.