Table of Contents for
OpenLayers 3.x Cookbook - Second Edition
 OpenLayers 3.x Cookbook - Second Edition
Published by
Packt Publishing, 2016
OpenLayers 3.x Cookbook - Second Edition
Published by
Packt Publishing, 2016
- Cover
- Table of Contents
- OpenLayers 3.x Cookbook Second Edition
- OpenLayers 3.x Cookbook Second Edition
- Credits
- About the Authors
- About the Reviewer
- www.PacktPub.com
- Preface
- What you need for this book
- Who this book is for
- Sections
- Conventions
- Reader feedback
- Customer support
- 1. Web Mapping Basics
- Creating a simple fullscreen map
- Playing with the map's options
- Managing the map's stack layers
- Managing the map's controls
- Moving around the map view
- Restricting the map's extent
- 2. Adding Raster Layers
- Using Bing imagery
- Using OpenStreetMap imagery
- Adding WMS layers
- Changing the zoom effect
- Changing layer opacity
- Buffering the layer data to improve map navigation
- Creating an image layer
- Setting the tile size in WMS layers
- 3. Working with Vector Layers
- Adding a GML layer
- Adding a KML layer
- Creating features programmatically
- Exporting features as GeoJSON
- Reading and creating features from a WKT
- Using point features as markers
- Removing or cloning features using overlays
- Zooming to the extent of a layer
- Adding text labels to geometry points
- Adding features from a WFS server
- Using the cluster strategy
- Reading features directly using AJAX
- Creating a heat map
- 4. Working with Events
- Creating a side-by-side map comparator
- Implementing a work-in-progress indicator for map layers
- Listening for the vector layer features' events
- Listening for mouse or touch events
- Using the keyboard to pan or zoom
- 5. Adding Controls
- Adding and removing controls
- Working with geolocation
- Placing controls outside the map
- Drawing features across multiple vector layers
- Modifying features
- Measuring distances and areas
- Getting feature information from a data source
- Getting information from a WMS server
- 6. Styling Features
- Styling layers
- Styling features based on geometry type
- Styling based on feature attributes
- Styling interaction render intents
- Styling clustered features
- 7. Beyond the Basics
- Working with projections
- Creating a custom control
- Selecting features by dragging out a selection area
- Transitioning between weather forecast imagery
- Using the custom OpenLayers library build
- Drawing in freehand mode
- Modifying layer appearance
- Adding features to the vector layer by dragging and dropping them
- Making use of map permalinks
- Index
A marker can be understood as a point of interest (POI) where we place an icon to identify it, and this icon has some information associated with it, such as a monument, a parking area, a bridge, and so on.
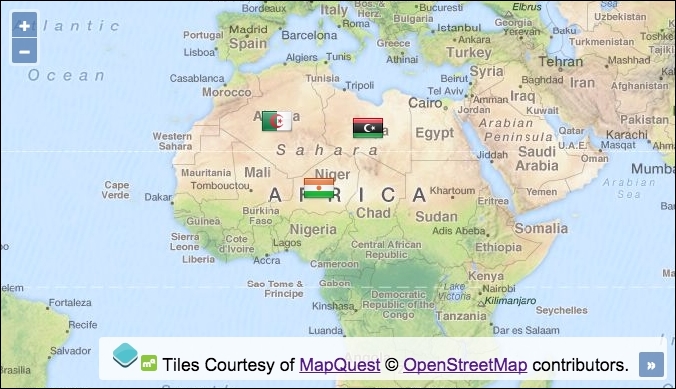
In this recipe, we will learn how to associate a custom marker icon with a point geometry type. The source code can be found in ch03/ch03-markers/. Here's what we'll end up with:
Use the following steps to learn how to attach an icon, in this case a flag, to a geometry point on the map:
- Create the HTML file with the OpenLayers dependencies and a
divto contain the map. - Create a custom JavaScript file; within this file, create a function to generate and return a custom feature style:
var createIconStyle = function(country) { return new ol.style.Style({ image: new ol.style.Icon({ src: country + '.png' }) }) }; - Create three geometry point features:
var algeria = new ol.Feature(new ol.geom.Point([146759,3297187]));
var libya = new ol.Feature(new ol.geom.Point([1927436,3160212]));
var niger = new ol.Feature(new ol.geom.Point([968610,1986139]));
- Assign the custom styles to each feature so that they contain the applicable icon image:
algeria.setStyle(createIconStyle('algeria')); libya.setStyle(createIconStyle('libya')); niger.setStyle(createIconStyle('niger')); - Create a vector layer and add the
featuresto the vectorsource:var vectorLayer = new ol.layer.Vector({ source: new ol.source.Vector({ features: [algeria, libya, niger] }) }); - Finally, instantiate
map,view, andlayers, as follows:var map = new ol.Map({ view: new ol.View({ zoom: 3, center: [1995923, -4167958] }), target: 'js-map', layers: [ new ol.layer.Tile({ source: new ol.source.MapQuest({layer: 'osm'}) }), vectorLayer ] });
We picked three geometry points that reside in three different countries across Africa. Each POI is provided with an icon that represents its respective country's flag.
To achieve this result, we have to use classes from the ol.style OpenLayers object. Let's take a closer look at this code:
return new ol.style.Style({
  image: new ol.style.Icon({
    src: country + '.png'
  })
})
Within our createIconStyle function, we instantiate a new instance of ol.style.Style. This returns the wrapper object that we need in order to create rendering styles for our vector features. It provides methods such as getImage, getFill, and setZIndex.
The image property expects a type of ol.style.Image, which is the base class for ol.style.Icon that we utilize here. The ol.style.Style class has other properties available, such as fill, stroke, and text. The ol.style.Image base class provides methods, such as getOpacity, getScale, and setRotation.
We dynamically set the value of the src property of our ol.style.Icon instance to a URL, which is built from the passed in country name. All images are in the .PNG format, so .png is always concatenated on to the end.
We've implicitly accepted a lot of the OpenLayers property defaults for ol.style.Icon, such as opacity as 1, anchor as [0.5, 0.5], which centers the icon position in the middle of the flag icon (which can be customized accordingly to suit the icon type), and the anchorXUnits type of 'fraction', rather than 'pixels'. There are many more customizable properties that I encourage you to check out.
algeria.setStyle(createIconStyle('algeria'));After we've created an instance of ol.Feature for each country, we must set the vector feature style for each individual feature, as they're all using unique images. The ol.Feature class provides the setStyle method that takes an instance (or an array of instances) of ol.style.Style, which is what's returned from our custom createIconStyle function.
The further parts of this recipe set up the vector layer and map, both of which we're comfortable with and will need no explanation.
The markers can, of course, be mutated after they've initially been added to a vector layer. For example, we may wish to programmatically adjust a property, such as the opacity of one of the flag icons.
Let's extend this recipe by setting the opacity of the first flag to 50%:
var vectorLayer = map.getLayers().item(1);
var feature = vectorLayer.getSource().getFeatures()[0];
feature.getStyle().getImage().setOpacity(0.5);
vectorLayer.changed();
We store a reference to the vector layer (the second layer on the map) in a variable named vectorLayer. We then go searching for the feature that we'd like to manipulate by accessing the vector layer source, grabbing all features from this source, and plucking just the first feature from the array. The result is stored in the feature variable.
We retrieve the style object from the feature (getStyle) and narrow our interest down to the image style object that contains our flag icon (getImage). We set the opacity to 50%.
However, this won't show any visible changes to the flag yet, as the vector layer needs to re-render itself for the changes to take effect. It's blissfully unaware of our modifications, so we give it a friendly nudge by manually calling the changed method on the vector layer, which subsequently increments the internal revision counter and dispatches a change event. OpenLayers responds by re-rendering the vector layer, and we can finally see that the first flag (Algeria) is now semi-opaque.