Table of Contents for
OpenLayers 3.x Cookbook - Second Edition
 OpenLayers 3.x Cookbook - Second Edition
Published by
Packt Publishing, 2016
OpenLayers 3.x Cookbook - Second Edition
Published by
Packt Publishing, 2016
- Cover
- Table of Contents
- OpenLayers 3.x Cookbook Second Edition
- OpenLayers 3.x Cookbook Second Edition
- Credits
- About the Authors
- About the Reviewer
- www.PacktPub.com
- Preface
- What you need for this book
- Who this book is for
- Sections
- Conventions
- Reader feedback
- Customer support
- 1. Web Mapping Basics
- Creating a simple fullscreen map
- Playing with the map's options
- Managing the map's stack layers
- Managing the map's controls
- Moving around the map view
- Restricting the map's extent
- 2. Adding Raster Layers
- Using Bing imagery
- Using OpenStreetMap imagery
- Adding WMS layers
- Changing the zoom effect
- Changing layer opacity
- Buffering the layer data to improve map navigation
- Creating an image layer
- Setting the tile size in WMS layers
- 3. Working with Vector Layers
- Adding a GML layer
- Adding a KML layer
- Creating features programmatically
- Exporting features as GeoJSON
- Reading and creating features from a WKT
- Using point features as markers
- Removing or cloning features using overlays
- Zooming to the extent of a layer
- Adding text labels to geometry points
- Adding features from a WFS server
- Using the cluster strategy
- Reading features directly using AJAX
- Creating a heat map
- 4. Working with Events
- Creating a side-by-side map comparator
- Implementing a work-in-progress indicator for map layers
- Listening for the vector layer features' events
- Listening for mouse or touch events
- Using the keyboard to pan or zoom
- 5. Adding Controls
- Adding and removing controls
- Working with geolocation
- Placing controls outside the map
- Drawing features across multiple vector layers
- Modifying features
- Measuring distances and areas
- Getting feature information from a data source
- Getting information from a WMS server
- 6. Styling Features
- Styling layers
- Styling features based on geometry type
- Styling based on feature attributes
- Styling interaction render intents
- Styling clustered features
- 7. Beyond the Basics
- Working with projections
- Creating a custom control
- Selecting features by dragging out a selection area
- Transitioning between weather forecast imagery
- Using the custom OpenLayers library build
- Drawing in freehand mode
- Modifying layer appearance
- Adding features to the vector layer by dragging and dropping them
- Making use of map permalinks
- Index
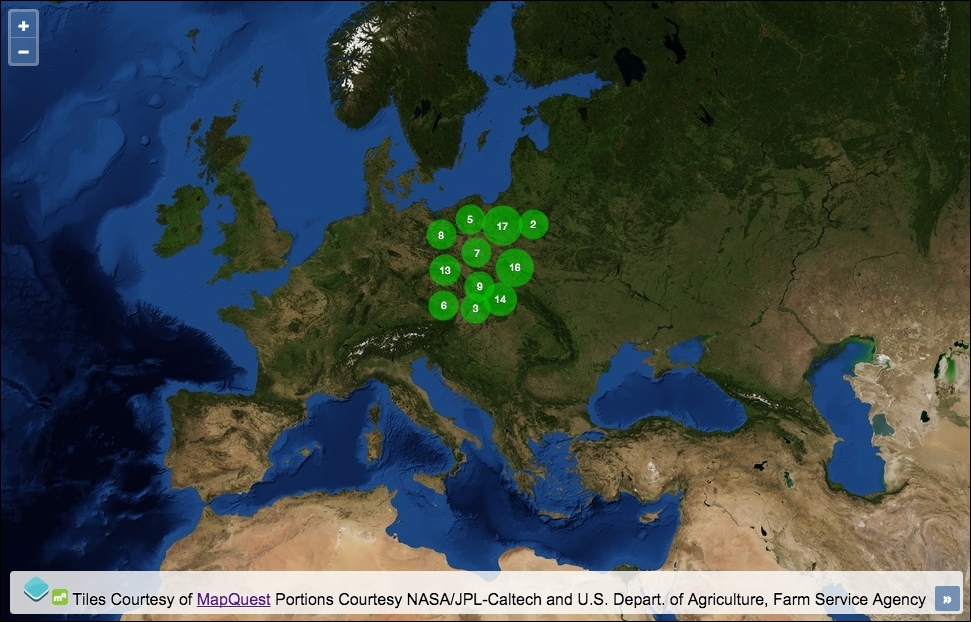
Imagine a scenario where we want to show all the gas stations in every city around the world. What will happen when the user navigates within the map and sets a zoom level to look at the whole world? We're presented with an overwhelming dominance of points, overlapping each other all at the same place, providing little visual value to the user.
A solution to this problem is to cluster the features on each zoom level. OpenLayers makes this very easy to implement.
This recipe (source code in ch03/ch03-clustering) shows how easy it is to apply clustering on a vector layer, which is responsible for grouping the features to avoid a situation similar to the one discussed earlier that can be seen in the following screenshot:
Utilize the great clustering capability of OpenLayers using the following instructions:
- Create an HTML file with OpenLayers dependencies and a
divelement to hold the map. - Initialize the
map, as follows:var map = new ol.Map({ view: new ol.View({ zoom: 4, center: [2152466, 5850795] }), target: 'js-map', layers: [ new ol.layer.Tile({ source: new ol.source.MapQuest({layer: 'sat'}) }) ] }); - Randomly generate a bunch of points that are restricted to a particular extent:
var getRandomInt = function(min, max) { return Math.floor(Math.random() * (max - min + 1)) + min; }; var features = []; var numberOfFeatures = 0; while(numberOfFeatures < 100) { var point = new ol.geom.Point([ getRandomInt(1545862, 2568284), getRandomInt(6102732, 7154505) ]); features.push(new ol.Feature(point)); numberOfFeatures++; } - Set up the styling function used to render the clusters:
var getStyle = function(feature) { var length = feature.get('features').length; return [ new ol.style.Style({ image: new ol.style.Circle({ radius: Math.min( Math.max(length * 1.2, 15), 20 ), fill: new ol.style.Fill({ color: [0, 204, 0, 0.6] }) }), text: new ol.style.Text({ text: length.toString(), fill: new ol.style.Fill({ color: 'white' }), stroke: new ol.style.Stroke({ color: [0, 51, 0, 1], width: 1 }), font: '10px "Helvetica Neue", Arial' }) }) ]; }; - Create the vector layer, add the cluster source, then add the layer to the map:
var vectorLayer = new ol.layer.Vector({
  source: new ol.source.Cluster({
    distance: 25,
    source: new ol.source.Vector({
      features: features
    })
  }),
  style: getStyle
});
map.addLayer(vectorLayer);
We randomly placed 100 geometry points within an arbitrary extent across Europe. We previously used this technique in the Exporting features as GeoJSON recipe, where we explained in detail how this works. If you need a reminder, head over to that recipe, as we'll move on and focus our attention on how the clustering is achieved.
Our getStyle method is called by OpenLayers when the cluster needs rendering. It's attached to the style property of the vector layer. We want to add a text label to display the number of points beneath the cluster and give the cluster some nondefault styling. We saw very similar styling with accompanying explanations in the Adding text label to geometry point recipe, so we will only take a look over some parts of the styling used for this recipe:
image: new ol.style.Circle({
  radius: Math.min(
    Math.max(length * 1.2, 15), 20
  ),
Circles will be drawn on the map to represent clusters of points. The more points a cluster contains, the larger the radius of the circle will be. Features that are part of a clustered source are applied a custom property, namely features. This contains an array of all the features within that cluster. We retrieve this value using the ol.Feature get method, feature.get('features').length, and store it in a variable, namely length.
We multiply the length of the features by 1.2, but we pick the maximum number of either the result of the multiplication or 15 using the JavaScript Math.max method. We don't want any clusters smaller than a radius of 15.
On the contrary, we don't want any cluster bigger than a radius of 20, so Math.min is used to wrap the result of the maximum radius and limit the radius if required.
text: new ol.style.Text({
  text: length.toString(),
The text of the cluster is simply derived from the number of features within the cluster array. The number must be converted to a string type for OpenLayers. The toString method is a native JavaScript method for type coercion.
The rest of the ol.style.Style object simply assigns colors, widths, and fonts wherever applicable.
var vectorLayer = new ol.layer.Vector({
  source: new ol.source.Cluster({
    distance: 25,
    source: new ol.source.Vector({
      features: features
    })
We create a vector layer as normal, but source is an instance of ol.source.Cluster (which extends the ol.source.Vector class).
The distance property of the cluster source enforces the minimum distance (in pixels) between clusters. The default is 20.
The source property of the cluster source is an instance of ol.source.Vector, where we pass in the 100 generated features from earlier.
Every time the zoom level changes, the cluster strategy computes the distance among all features and adds all the features that conform to some parameters of the same cluster.