Table of Contents for
OpenLayers 3.x Cookbook - Second Edition
 OpenLayers 3.x Cookbook - Second Edition
Published by
Packt Publishing, 2016
OpenLayers 3.x Cookbook - Second Edition
Published by
Packt Publishing, 2016
- Cover
- Table of Contents
- OpenLayers 3.x Cookbook Second Edition
- OpenLayers 3.x Cookbook Second Edition
- Credits
- About the Authors
- About the Reviewer
- www.PacktPub.com
- Preface
- What you need for this book
- Who this book is for
- Sections
- Conventions
- Reader feedback
- Customer support
- 1. Web Mapping Basics
- Creating a simple fullscreen map
- Playing with the map's options
- Managing the map's stack layers
- Managing the map's controls
- Moving around the map view
- Restricting the map's extent
- 2. Adding Raster Layers
- Using Bing imagery
- Using OpenStreetMap imagery
- Adding WMS layers
- Changing the zoom effect
- Changing layer opacity
- Buffering the layer data to improve map navigation
- Creating an image layer
- Setting the tile size in WMS layers
- 3. Working with Vector Layers
- Adding a GML layer
- Adding a KML layer
- Creating features programmatically
- Exporting features as GeoJSON
- Reading and creating features from a WKT
- Using point features as markers
- Removing or cloning features using overlays
- Zooming to the extent of a layer
- Adding text labels to geometry points
- Adding features from a WFS server
- Using the cluster strategy
- Reading features directly using AJAX
- Creating a heat map
- 4. Working with Events
- Creating a side-by-side map comparator
- Implementing a work-in-progress indicator for map layers
- Listening for the vector layer features' events
- Listening for mouse or touch events
- Using the keyboard to pan or zoom
- 5. Adding Controls
- Adding and removing controls
- Working with geolocation
- Placing controls outside the map
- Drawing features across multiple vector layers
- Modifying features
- Measuring distances and areas
- Getting feature information from a data source
- Getting information from a WMS server
- 6. Styling Features
- Styling layers
- Styling features based on geometry type
- Styling based on feature attributes
- Styling interaction render intents
- Styling clustered features
- 7. Beyond the Basics
- Working with projections
- Creating a custom control
- Selecting features by dragging out a selection area
- Transitioning between weather forecast imagery
- Using the custom OpenLayers library build
- Drawing in freehand mode
- Modifying layer appearance
- Adding features to the vector layer by dragging and dropping them
- Making use of map permalinks
- Index
Points of interest in the real world can be represented through a variety of shapes, such as circles and lines, but the geometry alone may not be informative enough for various purposes. For example, you may have some polygons representing zones, but you want to label these zones as zone A, zone B, and zone C. Or perhaps, you need to display the number of people at a location, represented with a circle and a label containing the count.
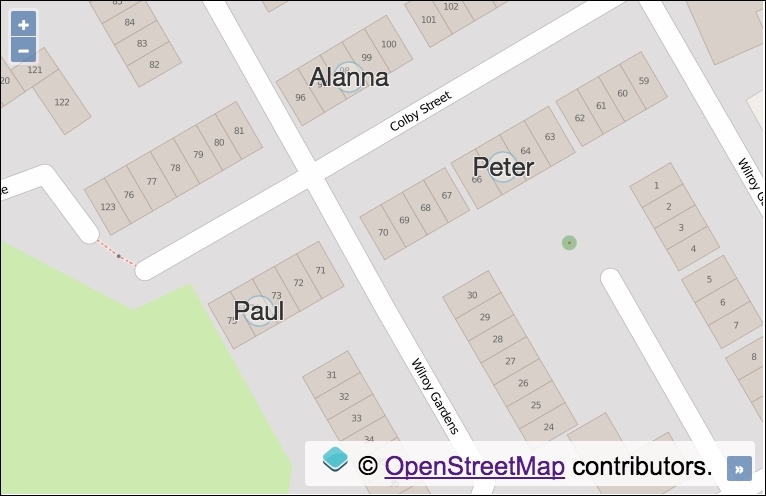
For this recipe, we will assign the name of a person to a geometry point. The features will be placed at some houses. You can use your imagination as to why this may be useful! The source code can be found in ch03/ch03-geometry-labels/. Here's a screenshot of what we'll end up with:
We will learn how to add useful text labels to geometry points using the following steps:
- Create an HTML file with OpenLayers dependencies and a
divelement to hold the map. - Create a custom JavaScript file and instantiate the
map,view, and raster layer:var map = new ol.Map({ view: new ol.View({ zoom: 19, center: [-161669, 6609321] }), target: 'js-map', layers: [ new ol.layer.Tile({ source: new ol.source.OSM() }) ] }); - Create a function that'll be used to generate point features with a text label:
var createPoint = function(coords, resident) { var feature = new ol.Feature(new ol.geom.Point(coords)); feature.set('resident', resident); return feature; }; - Create the function that'll be used to style the point features:
var getStyle = function(feature) { return [ new ol.style.Style({ text: new ol.style.Text({ text: feature.get('resident'), fill: new ol.style.Fill({ color: '#333' }), stroke: new ol.style.Stroke({ color: [255, 255, 255, 0.8], width: 2 }), font: '26px "Helvetica Neue", Arial' }), image: new ol.style.Circle({ fill: new ol.style.Fill({ color: [255, 255, 255, 0.3] }), stroke: new ol.style.Stroke({ color: [51, 153, 204, 0.4], width: 1.5 }), radius: 15 }) }) ]; }; - Add the vector layer to the map with our generated point features and styling function:
map.addLayer(
  new ol.layer.Vector({
    source: new ol.source.Vector({
      features: [
        createPoint([-161705, 6609398], 'Alanna'),
        createPoint([-161659, 6609371], 'Peter'),
        createPoint([-161732, 6609328], 'Paul')
      ]
    }),
    style: getStyle
  })
);
The main two aspects of this recipe are how to set a custom property against a feature, and how to render this label on to the map. Let's break it down, as follows:
var createPoint = function(coords, resident) {
  var feature = new ol.Feature(new ol.geom.Point(coords));
  feature.set('resident', resident);
  return feature;
};
For convenience, we create the point features from this reusable function. Our function takes an array of coordinates (coords) and the name of the resident (resident). This creates the point geometry feature based on the passed in coordinates, then assigns the name of the resident to a custom property of the feature itself, namely resident. The set method is inherited from the ol.Object class.
Next up is our getStyle function, which is in the format that OpenLayers requires (ol.style.StyleFunction). When it's called by OpenLayers, it is passed the instance of ol.Feature and the view's resolution, respectively. Our function will completely determine how this feature gets styled. In order to meet the OpenLayers function contract, our method must return an array with one or more ol.style.Style instances.
text: new ol.style.Text({
  text: feature.get('resident'),
  fill: new ol.style.Fill({
    color: '#333'
  }),
  stroke: new ol.style.Stroke({
    color: [255, 255, 255, 0.8],
    width: 2
  }),
  font: '26px "Helvetica Neue", Arial'
}),
Inline of the returned array, we create one new instance of ol.style.Style, omitted in the previous code for brevity. Within the configuration object, we supply a value for the text property, which is an instance of ol.style.Text. The configuration object for this constructor also has a text property. As OpenLayers passes in the feature for us, the feature variable will be in scope when getStyle is called, so we simply retrieve the resident value from the feature itself via the get method of ol.Object.
We also provide fill with color, stroke with color, width, and font with size and family. There are many other properties and style types available, such as the lineDash property for strokes and the style type ol.style.RegularShape.
You'll notice that color can be defined in various ways. For the fill property, we provided the color as a string in shorthand Hex format. For stroke, we passed in an array of type ol.Color in the RGBA (Red, Green, Blue, Alpha) format.
image: new ol.style.Circle({
  fill: new ol.style.Fill({
    color: [255, 255, 255, 0.3]
  }),
  stroke: new ol.style.Stroke({
    color: [51, 153, 204, 0.4],
    width: 1.5
  }),
  radius: 15
})
The second and last property of the ol.style.Style instance is image. This is what's used to render a circle behind the text label. We set the fill and stroke colors using the RGBA array technique and also provide a stroke width and circle radius.
new ol.layer.Vector({
    source: new ol.source.Vector({
      features: [
        createPoint([-161705, 6609398], 'Alanna'),
        createPoint([-161659, 6609371], 'Peter'),
        createPoint([-161732, 6609328], 'Paul')
      ]
    }),
    style: getStyle
  })
When the vector layer is created, we call our custom createPoint function three times to return the geometry points inline of the features array.
Our custom getStyle method is assigned to the style property of the vector layer. It will be called by OpenLayers when a feature from this layer needs styling with the feature and resolution arguments, as previously mentioned.
We explore styling much further in Chapter 6, Styling Features.