Table of Contents for
OpenLayers 3.x Cookbook - Second Edition
 OpenLayers 3.x Cookbook - Second Edition
Published by
Packt Publishing, 2016
OpenLayers 3.x Cookbook - Second Edition
Published by
Packt Publishing, 2016
- Cover
- Table of Contents
- OpenLayers 3.x Cookbook Second Edition
- OpenLayers 3.x Cookbook Second Edition
- Credits
- About the Authors
- About the Reviewer
- www.PacktPub.com
- Preface
- What you need for this book
- Who this book is for
- Sections
- Conventions
- Reader feedback
- Customer support
- 1. Web Mapping Basics
- Creating a simple fullscreen map
- Playing with the map's options
- Managing the map's stack layers
- Managing the map's controls
- Moving around the map view
- Restricting the map's extent
- 2. Adding Raster Layers
- Using Bing imagery
- Using OpenStreetMap imagery
- Adding WMS layers
- Changing the zoom effect
- Changing layer opacity
- Buffering the layer data to improve map navigation
- Creating an image layer
- Setting the tile size in WMS layers
- 3. Working with Vector Layers
- Adding a GML layer
- Adding a KML layer
- Creating features programmatically
- Exporting features as GeoJSON
- Reading and creating features from a WKT
- Using point features as markers
- Removing or cloning features using overlays
- Zooming to the extent of a layer
- Adding text labels to geometry points
- Adding features from a WFS server
- Using the cluster strategy
- Reading features directly using AJAX
- Creating a heat map
- 4. Working with Events
- Creating a side-by-side map comparator
- Implementing a work-in-progress indicator for map layers
- Listening for the vector layer features' events
- Listening for mouse or touch events
- Using the keyboard to pan or zoom
- 5. Adding Controls
- Adding and removing controls
- Working with geolocation
- Placing controls outside the map
- Drawing features across multiple vector layers
- Modifying features
- Measuring distances and areas
- Getting feature information from a data source
- Getting information from a WMS server
- 6. Styling Features
- Styling layers
- Styling features based on geometry type
- Styling based on feature attributes
- Styling interaction render intents
- Styling clustered features
- 7. Beyond the Basics
- Working with projections
- Creating a custom control
- Selecting features by dragging out a selection area
- Transitioning between weather forecast imagery
- Using the custom OpenLayers library build
- Drawing in freehand mode
- Modifying layer appearance
- Adding features to the vector layer by dragging and dropping them
- Making use of map permalinks
- Index
With HTML5, one of the many new APIs and concepts introduced in this specification is the possibility of identifying the location of the client that is loading the web page through the Geolocation API (http://www.w3.org/TR/geolocation-API/). Of course, in the world of web mapping applications, this opens new and great possibilities.
In this recipe, we are going to show you how easily we can identify the current location of the user and center the map's viewport to it. The source code for this can be found in ch05/ch05-geolocation. Here's a screenshot of what we'll produce:
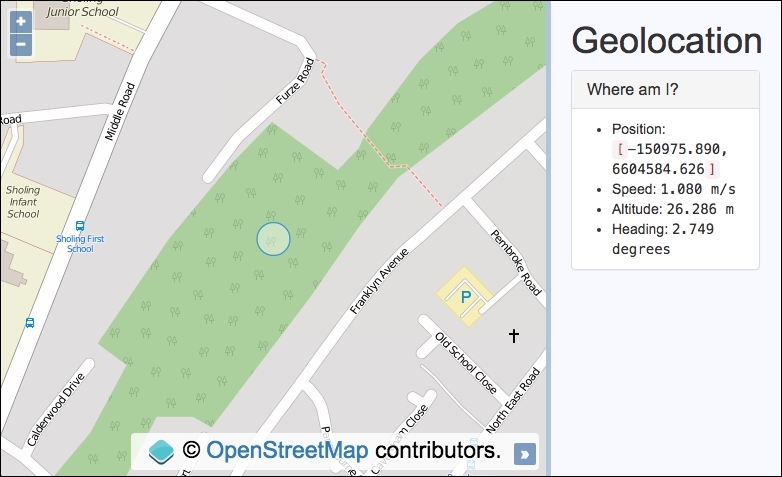
When the user loads the web page, the map's viewport will be moved to the current user's location and a circle will be placed at the center. We will also display other location metrics in the sidebar if available, such as speed and altitude.
To quickly see this recipe in action on your own device, visit a live copy at https://jsfiddle.net/pjlangley/9yyLovt5/.
When accessing a map in the browser with geolocation enabled, you may need to manually allow the geolocation request in order for it to work properly. Most browser vendors will conspicuously prompt for your action here. For mobile devices, you may need to check your privacy settings to ensure that location services are available within your mobile browser.
To understand how to work with the Geolocation API in OpenLayers, follow these instructions:
- First, create the HTML file with OpenLayers dependencies and
divto hold the map. In particular, here's the markup that makes up the geolocation metrics that'll be populated:<ul> <li>Position: <code>[</code> <samp id="js-position">n/a</samp> <code>]</code></li> <li>Speed: <samp id="js-speed">0</samp></li> <li>Altitude: <samp id="js-altitude">n/a</samp></li> <li>Heading: <samp id="js-heading">n/a</samp></li> </ul>
- Create a JavaScript file and cache some DOM elements for reuse, as well as the OpenLayers circle feature:
var locationCircle = new ol.Feature(); var positionElem = document.getElementById('js-position'); var speedElem = document.getElementById('js-speed'); var altitudeElem = document.getElementById('js-altitude'); var headingElem = document.getElementById('js-heading'); - Instantiate
mapwithview, a raster layer, and a vector layer with the circle feature:var map = new ol.Map({ view: new ol.View({ zoom: 17, center: [10030840, 6731350] }), target: 'js-map', layers: [ new ol.layer.Tile({ source: new ol.source.OSM() }), new ol.layer.Vector({ source: new ol.source.Vector({ features: [locationCircle] }) }) ] }); - Set up the geolocation options, subscribe to location change events, carry out the necessary logic to reposition the map and circle, and update the sidebar display, as follows:
new ol.Geolocation({
  projection: map.getView().getProjection(),
  tracking: true,
  trackingOptions: {
    enableHighAccuracy: true
  }
})
.on('change', function() {
  var position = this.getPosition();
  var speed = this.getSpeed();
  var altitude = this.getAltitude();
  var heading = this.getHeading();

  map.getView().setCenter(position);

  locationCircle.setGeometry(
    new ol.geom.Circle(position, 20)
  );

  positionElem.innerHTML = position.join(',<br>');
  speedElem.innerHTML = speed ? speed.toFixed(3) + ' m/s' : 'n/a';
  altitudeElem.innerHTML =
    altitude ? altitude.toFixed(3) + ' m' : 'n/a';
  headingElem.innerHTML =
    heading ? heading.toFixed(3) + ' degrees' : 'n/a';
});
With the help of the Bootstrap CSS framework, we've styled the sidebar to present the geolocation information. Please review the source code for the full implementation, as it's been omitted for brevity.
We start the JavaScript by caching references to the DOM elements that'll display the data. This is performant as they'll be frequently accessed throughout the code. The circle feature is also stored into a variable, namely locationCircle, as the geometry is frequently updated.
The map instantiation will look familiar to earlier recipes, so let's dig deeper into the OpenLayers code behind the geolocation capabilities:
new ol.Geolocation({
  projection: map.getView().getProjection(),
  tracking: true,
  trackingOptions: {
    enableHighAccuracy: true
  }
})
OpenLayers has an HTML5 Geolocation API helper class, namely ol.Geolocation. This helper class interacts with the JavaScript API on our behalf using the window.navigator.geolocation.watchPosition method to set up and subscribe to geolocation changes.
When working with HTML5 technologies, it's a sensible idea to confirm the range of browser support that is available. The website, http://caniuse.com, is a useful resource for this type of information.
When instantiating ol.Geolocation, we specify some configuration properties. We inform OpenLayers of the projection by passing in the current projection of the view. By setting tracking to true, we automatically begin tracking the users position (so long as the user has allowed this) as soon as the page loads. In addition to this, we have supplied an object with enableHighAccuracy set to true. This setting requests for the best possible results from the application. Be mindful that on mobile devices, this could consume more power and bandwidth.
Refer to a list of the other position options available for the Geolocation API at http://www.w3.org/TR/geolocation-API/#position_options_interface.
.on('change', function() {
  var position = this.getPosition();
  var speed = this.getSpeed();
  var altitude = this.getAltitude();
  var heading = this.getHeading();
We chain the on method to the end of the geolocation instantiation and subscribe to the generic change event. This is a catch-all event listener that will respond to the latest position, speed, and altitude updates, among many other changes.
The geolocation helper class provides many get methods to retrieve the latest values. We store these values in variables, such as speed, containing the result of this.getSpeed(). In this case, this JavaScript keyword references our geolocation instance.
  map.getView().setCenter(position);
  locationCircle.setGeometry(
    new ol.geom.Circle(position, 20)
  );
With the latest coordinates, we center the map view accordingly and update the geometry of the circle feature on the vector layer with these same coordinates. The ol.geom.Circle constructor takes the ol.Coordinate array and a radius as arguments. The resulting geometry is used by the feature method, setGeometry, in order to update the location of the circle.
positionElem.innerHTML = position.join(',<br>');
speedElem.innerHTML = speed ? speed.toFixed(3) + ' m/s' : 'n/a';
altitudeElem.innerHTML =
  altitude ? altitude.toFixed(3) + ' m' : 'n/a';
headingElem.innerHTML =
  heading ? heading.toFixed(3) + ' degrees' : 'n/a';
To finish off, we update the sidebar with all the latest readings. The position array of type ol.Coordinate is passed through the JavaScript join method so that the array entries are presented as strings with a comma and HTML markup, <br>, in between.
The speed, altitude, and heading values are fixed at 3 decimal places (toFixed(3)) and the units of measurement are appended to the string. If a geolocation type doesn't have a value available, then the 'n/a' string is used instead. The innerHTML JavaScript method populates the DOM element.
As per the Geolocation API specification (http://www.w3.org/TR/geolocation-API/#coordinates_interface), speed is in meters per second, altitude is in meters, and heading is in degrees (0-360).
To witness the best results, I suggest viewing this example on a mobile device while on the move. You'll hopefully be able to see all the values update as you move around.