Table of Contents for
OpenLayers 3.x Cookbook - Second Edition
 OpenLayers 3.x Cookbook - Second Edition
Published by
Packt Publishing, 2016
OpenLayers 3.x Cookbook - Second Edition
Published by
Packt Publishing, 2016
- Cover
- Table of Contents
- OpenLayers 3.x Cookbook Second Edition
- OpenLayers 3.x Cookbook Second Edition
- Credits
- About the Authors
- About the Reviewer
- www.PacktPub.com
- Preface
- What you need for this book
- Who this book is for
- Sections
- Conventions
- Reader feedback
- Customer support
- 1. Web Mapping Basics
- Creating a simple fullscreen map
- Playing with the map's options
- Managing the map's stack layers
- Managing the map's controls
- Moving around the map view
- Restricting the map's extent
- 2. Adding Raster Layers
- Using Bing imagery
- Using OpenStreetMap imagery
- Adding WMS layers
- Changing the zoom effect
- Changing layer opacity
- Buffering the layer data to improve map navigation
- Creating an image layer
- Setting the tile size in WMS layers
- 3. Working with Vector Layers
- Adding a GML layer
- Adding a KML layer
- Creating features programmatically
- Exporting features as GeoJSON
- Reading and creating features from a WKT
- Using point features as markers
- Removing or cloning features using overlays
- Zooming to the extent of a layer
- Adding text labels to geometry points
- Adding features from a WFS server
- Using the cluster strategy
- Reading features directly using AJAX
- Creating a heat map
- 4. Working with Events
- Creating a side-by-side map comparator
- Implementing a work-in-progress indicator for map layers
- Listening for the vector layer features' events
- Listening for mouse or touch events
- Using the keyboard to pan or zoom
- 5. Adding Controls
- Adding and removing controls
- Working with geolocation
- Placing controls outside the map
- Drawing features across multiple vector layers
- Modifying features
- Measuring distances and areas
- Getting feature information from a data source
- Getting information from a WMS server
- 6. Styling Features
- Styling layers
- Styling features based on geometry type
- Styling based on feature attributes
- Styling interaction render intents
- Styling clustered features
- 7. Beyond the Basics
- Working with projections
- Creating a custom control
- Selecting features by dragging out a selection area
- Transitioning between weather forecast imagery
- Using the custom OpenLayers library build
- Drawing in freehand mode
- Modifying layer appearance
- Adding features to the vector layer by dragging and dropping them
- Making use of map permalinks
- Index
When a group of features coexist on a vector map layer, such as circles and polygons, they make up a shared extent, which is also known as a bounding box. This rectangular extent accommodates all the geometries. It can be useful to acquire the extent of such a group of features so that we can reposition the map at optimal resolution for the point of interest, which is exactly what we will do in this recipe.
We will place some features on the map at low resolution, but initially, we will configure the map resolution to start much higher. The group of features will appear small to begin with, but we'll provide a button that conveniently pans and zooms the user much closer to the group of features, based on their combined extent.
The source code can be found in ch03/ch03-zoom-to-extent/. We'll end up with something that looks like the following screenshot:
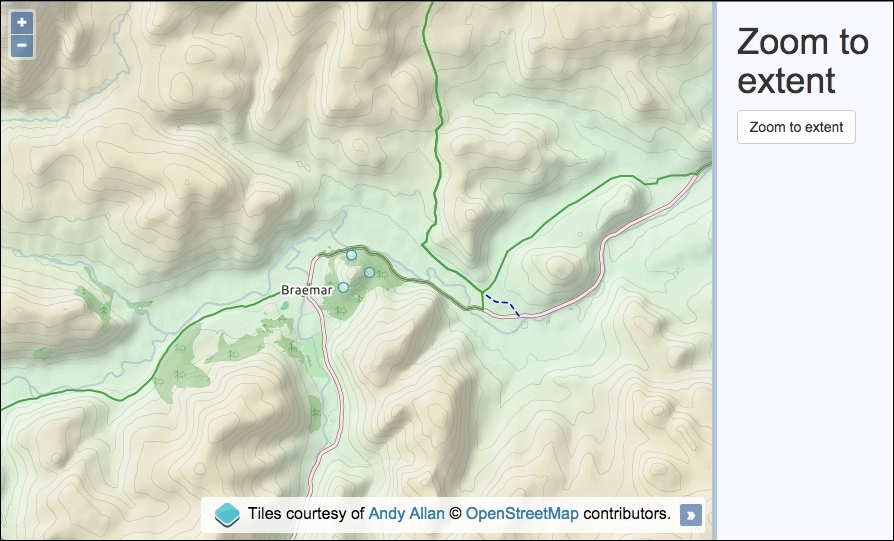
Discover how you can zoom to the extent of some features on a layer using the following instructions:
- Create an HTML file with OpenLayers dependencies, a
divelement to hold the map, and also the panel to house the button:<div id="js-map"></div> <div> <button id="js-zoom">Zoom to extent</button> </div>
- Create a custom JavaScript file and create a raster layer for the background mapping:
var rasterLayer = new ol.layer.Tile({ source: new ol.source.OSM({ attributions: [ new ol.Attribution({ html: 'Tiles courtesy of ' + '<a href="http://www.thunderforest.com">Andy Allan</a>' }), ol.source.OSM.ATTRIBUTION ], url: 'http://{a-c}.tile.thunderforest.com/cycle/' + '{z}/{x}/{y}.png' }) }); - Create a vector layer with some geometries, as follows:
var vectorLayer = new ol.layer.Vector({ source: new ol.source.Vector({ features: [ new ol.Feature(new ol.geom.Circle([-376645, 7762876], 200)), new ol.Feature(new ol.geom.Circle([-375955, 7762195], 200)), new ol.Feature(new ol.geom.Circle([-376953, 7761632], 200)) ] }) }); - Instantiate a new
map:var map = new ol.Map({ view: new ol.View({ zoom: 11, center: [-372592, 7763536] }), target: 'js-map', layers: [rasterLayer, vectorLayer] }); - Finally, add the button
clickhandler and logic to recenter the map, as follows:document.getElementById('js-zoom') .addEventListener('click', function() { map.beforeRender( ol.animation.pan({ source: map.getView().getCenter(), duration: 150 }), ol.animation.zoom({ resolution: map.getView().getResolution(), duration: 500, easing: ol.easing.easeIn }) ); map.getView().fit( vectorLayer.getSource().getExtent(), map.getSize() ); });
Let's concentrate on what happens when the button is clicked, as this is where the OpenLayers code is utilized to relocate the map:
  map.beforeRender(
    ol.animation.pan({
      source: map.getView().getCenter(),
      duration: 150
    }),
    ol.animation.zoom({
      resolution: map.getView().getResolution(),
      duration: 500,
      easing: ol.easing.easeIn
    })
  );
Within the click handler, we start off by adding two animation pre-render functions (ol.animation.pan and ol.animation.zoom). We are momentarily going to be relocating the map view center position and zoom level based on the extent of the features, and we wish to perform this change through graceful transitions. The details of these types of transition behaviors and how they work have previously been covered in the Moving around the map view recipe in Chapter 1, Web Mapping Basics.
map.getView().fit(
   vectorLayer.getSource().getExtent(), map.getSize()
);
The map view (retrieved via the getView map method) contains a method called fit. The purpose of fit is to accommodate the given geometry or extent into a customized area (normally the same size of map viewport, but it doesn't have to be).
The fit method expects the first parameter to be one of two types, of which, we're interested in the type ol.Extent. This type is just an array of coordinates that make up the bounding box of our features. The vector source has a method called getExtent that enables us to retrieve this information. We pass in the resulting ol.Extent array as the first parameter.
The second parameter of fit expects a type of ol.Size, which is simply an array containing the width and height of the box in pixels. We want the extent of the features to fit as best they can into the viewport of the map, so we use the getSize map method, which returns the size in the desired format.
The fit method optionally takes a third parameter—an object of configurable properties, such as minResolution, which can be used to determine the minimum resolution that you'd like to see the extent of the features at when this function is called.
The fit method will automatically adjust the map view at the most optimal resolution that's available so that all features are in sight.