Table of Contents for
OpenLayers 3.x Cookbook - Second Edition
 OpenLayers 3.x Cookbook - Second Edition
Published by
Packt Publishing, 2016
OpenLayers 3.x Cookbook - Second Edition
Published by
Packt Publishing, 2016
- Cover
- Table of Contents
- OpenLayers 3.x Cookbook Second Edition
- OpenLayers 3.x Cookbook Second Edition
- Credits
- About the Authors
- About the Reviewer
- www.PacktPub.com
- Preface
- What you need for this book
- Who this book is for
- Sections
- Conventions
- Reader feedback
- Customer support
- 1. Web Mapping Basics
- Creating a simple fullscreen map
- Playing with the map's options
- Managing the map's stack layers
- Managing the map's controls
- Moving around the map view
- Restricting the map's extent
- 2. Adding Raster Layers
- Using Bing imagery
- Using OpenStreetMap imagery
- Adding WMS layers
- Changing the zoom effect
- Changing layer opacity
- Buffering the layer data to improve map navigation
- Creating an image layer
- Setting the tile size in WMS layers
- 3. Working with Vector Layers
- Adding a GML layer
- Adding a KML layer
- Creating features programmatically
- Exporting features as GeoJSON
- Reading and creating features from a WKT
- Using point features as markers
- Removing or cloning features using overlays
- Zooming to the extent of a layer
- Adding text labels to geometry points
- Adding features from a WFS server
- Using the cluster strategy
- Reading features directly using AJAX
- Creating a heat map
- 4. Working with Events
- Creating a side-by-side map comparator
- Implementing a work-in-progress indicator for map layers
- Listening for the vector layer features' events
- Listening for mouse or touch events
- Using the keyboard to pan or zoom
- 5. Adding Controls
- Adding and removing controls
- Working with geolocation
- Placing controls outside the map
- Drawing features across multiple vector layers
- Modifying features
- Measuring distances and areas
- Getting feature information from a data source
- Getting information from a WMS server
- 6. Styling Features
- Styling layers
- Styling features based on geometry type
- Styling based on feature attributes
- Styling interaction render intents
- Styling clustered features
- 7. Beyond the Basics
- Working with projections
- Creating a custom control
- Selecting features by dragging out a selection area
- Transitioning between weather forecast imagery
- Using the custom OpenLayers library build
- Drawing in freehand mode
- Modifying layer appearance
- Adding features to the vector layer by dragging and dropping them
- Making use of map permalinks
- Index
In the earlier recipes, we saw how to read in data from different formats, such as GML and KML, but what about exporting data from a map? A user of your mapping application may want to get a copy of the vector layer data to use it somewhere else. Or perhaps, you're saving the state of a map and need to send the layer content to a server for persistent storage so that the same geometry can be retrieved later.
In this recipe, we will export the contents of a vector layer to the GeoJSON format. The source code can be found in ch03/ch03-export-geojson. Here's what we'll end up with:
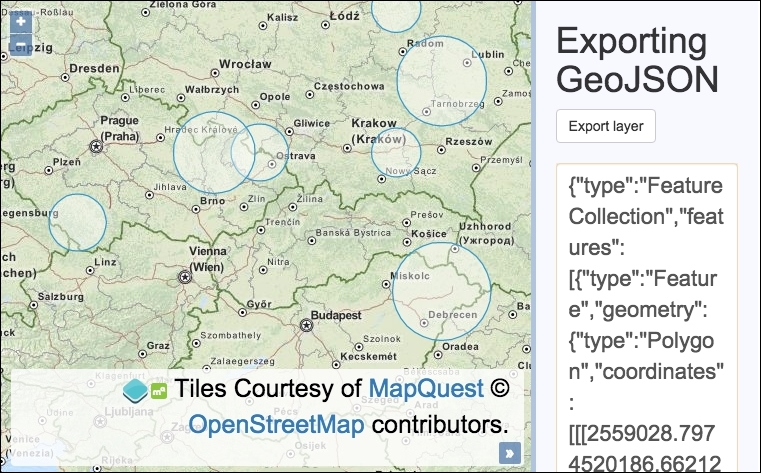
We are going to enable the use of an export button that will output the vector layer features as GeoJSON in a text box. Follow these steps to achieve this goal:
- Create the HTML file with OpenLayers dependencies. In particular, create the following:
<div id="js-map"></div> <div> <h1>Exporting GeoJSON</h1> <form> <button type="submit">Export layer</button> <textarea id="js-textarea"></textarea> </form> </div> - Create a JavaScript file, and initialize the
map,view, and background raster layers:var map = new ol.Map({ view: new ol.View({ zoom: 5, center: [2103547, 6538117] }), target: 'js-map', layers: [ new ol.layer.Tile({ source: new ol.source.MapQuest({layer: 'osm'}) }) ] }); - Create a method for randomly picking an integer from a range of integers, as follows:
var getRandomInt = function(min, max) { return Math.floor(Math.random() * (max - min + 1)) + min; }; - Build an array of randomly generated circular features, as follows:
var features = [], numberOfFeatures = 0; while(numberOfFeatures < 10) { var circle = new ol.geom.Circle( ol.proj.fromLonLat( [getRandomInt(14, 23), getRandomInt(48, 54)] ), getRandomInt(4, 15) * 10000 ); var polygonCircle = ol.geom.Polygon.fromCircle(circle); features.push(new ol.Feature(polygonCircle)); numberOfFeatures++; } - Create the vector layer, add
featuresto the vector source, and add this tomap:var vectorLayer = new ol.layer.Vector({ source: new ol.source.Vector({ features: features }) }); map.addLayer(vectorLayer); - Add a listener to the
exportbutton and exportfeaturesas GeoJSON to the text box:document.forms[0].addEventListener('submit', function(event) { event.preventDefault(); var format = new ol.format.GeoJSON(); var features = vectorLayer.getSource().getFeatures(); var geoJson = format.writeFeatures(features); document.getElementById('js-textarea').value = geoJson; });
The JavaScript contains a method (getRandomInt) that picks an integer between a range at random. For more information on the inner workings of this method, visit http://stackoverflow.com/questions/1527803.
Let's focus on the new components that are utilized throughout this recipe:
var circle = new ol.geom.Circle(
ol.proj.fromLonLat(
[getRandomInt(14, 23), getRandomInt(48, 54)]
),
getRandomInt(4, 15) * 10000
);Within the while loop (that performs 10 iterations), we created a circle geometry each time. In order to programmatically create a set of differently sized circles, we've supplied a range of numbers representing longitude and latitude values that are randomly selected by getRandomInt. These ranges form an inaccurate bounding box around Poland, Europe.
The view uses the EPSG:3857 projection, so we use ol.proj.fromLonLat to convert the longitude and latitude values to this projection (which is the default if it is not specified as the second parameter).
We also create a randomly generated radius, which then gets multiplied by 10,000 so that it's clearly visible at the starting resolution.
var polygonCircle = ol.geom.Polygon.fromCircle(circle);
We convert the circle geometry to a regular polygon feature, which produces an approximated circle. This part may not be apparent, but GeoJSON (at the time of writing) doesn't support circle geometries yet, so we must convert it to a regular polygon so that it can be serialized and exported later on.
features.push(new ol.Feature(polygonCircle));
The polygon circle is then converted into an ol.Feature instance so that OpenLayers can use it on the layer source, as follows.
document.forms[0].addEventListener('submit', function(event) {
    event.preventDefault();
    var format = new ol.format.GeoJSON();
    var features = vectorLayer.getSource().getFeatures();
    var geoJson = format.writeFeatures(features);
    document.getElementById('js-textarea').value = geoJson;
});We add a submit event listener to the first and only form on the page, which prevents the default form submission.
We create a new instance of the GeoJSON format and store it in the format variable. The vector features are retrieved from the layer source via the helpful getSource method from the vector layer and through the getFeatures method from the vector source.
The GeoJSON is finally serialized using the writeFeatures method from the GeoJSON format provider, which expects an array of OpenLayers features. The GeoJSON string is then displayed inside the textarea element.
Displaying it in the textbox is one idea. You may decide to perform other actions with this data, such as posting it via AJAX to a server to save it, and so on.