Table of Contents for
OpenLayers 3.x Cookbook - Second Edition
 OpenLayers 3.x Cookbook - Second Edition
Published by
Packt Publishing, 2016
OpenLayers 3.x Cookbook - Second Edition
Published by
Packt Publishing, 2016
- Cover
- Table of Contents
- OpenLayers 3.x Cookbook Second Edition
- OpenLayers 3.x Cookbook Second Edition
- Credits
- About the Authors
- About the Reviewer
- www.PacktPub.com
- Preface
- What you need for this book
- Who this book is for
- Sections
- Conventions
- Reader feedback
- Customer support
- 1. Web Mapping Basics
- Creating a simple fullscreen map
- Playing with the map's options
- Managing the map's stack layers
- Managing the map's controls
- Moving around the map view
- Restricting the map's extent
- 2. Adding Raster Layers
- Using Bing imagery
- Using OpenStreetMap imagery
- Adding WMS layers
- Changing the zoom effect
- Changing layer opacity
- Buffering the layer data to improve map navigation
- Creating an image layer
- Setting the tile size in WMS layers
- 3. Working with Vector Layers
- Adding a GML layer
- Adding a KML layer
- Creating features programmatically
- Exporting features as GeoJSON
- Reading and creating features from a WKT
- Using point features as markers
- Removing or cloning features using overlays
- Zooming to the extent of a layer
- Adding text labels to geometry points
- Adding features from a WFS server
- Using the cluster strategy
- Reading features directly using AJAX
- Creating a heat map
- 4. Working with Events
- Creating a side-by-side map comparator
- Implementing a work-in-progress indicator for map layers
- Listening for the vector layer features' events
- Listening for mouse or touch events
- Using the keyboard to pan or zoom
- 5. Adding Controls
- Adding and removing controls
- Working with geolocation
- Placing controls outside the map
- Drawing features across multiple vector layers
- Modifying features
- Measuring distances and areas
- Getting feature information from a data source
- Getting information from a WMS server
- 6. Styling Features
- Styling layers
- Styling features based on geometry type
- Styling based on feature attributes
- Styling interaction render intents
- Styling clustered features
- 7. Beyond the Basics
- Working with projections
- Creating a custom control
- Selecting features by dragging out a selection area
- Transitioning between weather forecast imagery
- Using the custom OpenLayers library build
- Drawing in freehand mode
- Modifying layer appearance
- Adding features to the vector layer by dragging and dropping them
- Making use of map permalinks
- Index
Web Map Service (WMS) is a standard developed by the Open Geospatial Consortium (OGC) implemented by many geospatial servers, among which we can find the free and open source projects GeoServer (http://geoserver.org) and MapServer (http://mapserver.org). More information on WMS can be found at http://en.wikipedia.org/wiki/Web_Map_Service.
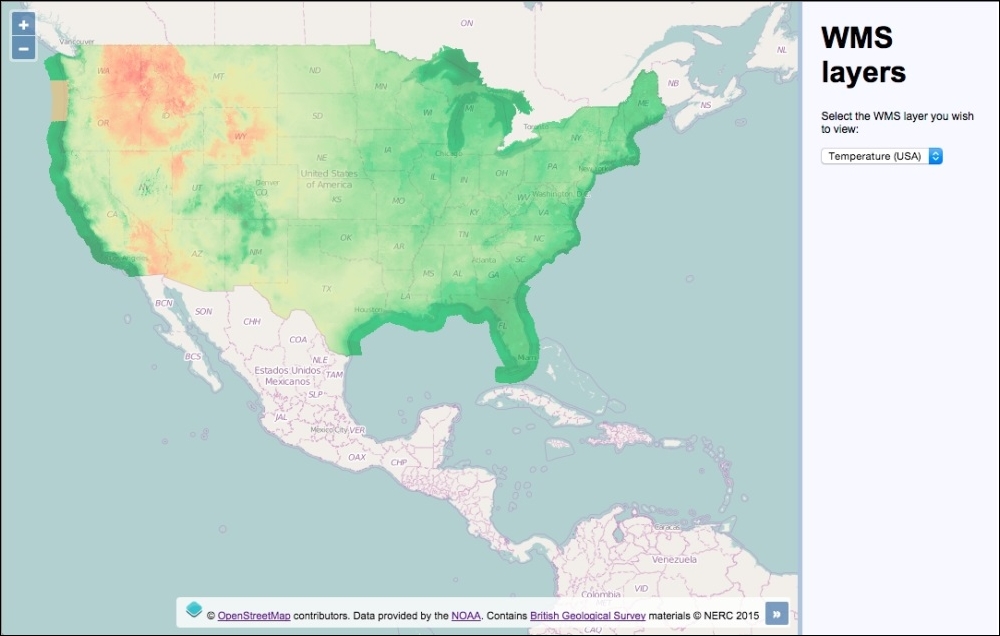
As a very basic summary, you can understand a WMS server as a normal HTTP web server that accepts requests with some GIS-related parameters (such as projection, bounding box, and so on), and returns map tiles forming a mosaic that covers the requested bounding box. Here's the finished recipe outcome using a WMS layer that covers the extent of the USA (source code can be found in ch02/ch02-wms-layers/):
Note
We are going to work with remote WMS servers, so it is not necessary you have one installed yourself. Note that we are not responsible for these servers and that they may have problems, or may not be available any longer when you read this section.
Any other WMS server can be used, but the URL and layer name must be known.
We will add two WMS layers to work with. To do this, perform the following steps:
- Create an HTML file and add the OpenLayers dependencies. In particular, create the HTML to hold the map and the layer panel:
<div id="js-map" class="map"></div> <div class="pane"> <h1>WMS layers</h1> <p>Select the WMS layer you wish to view:</p> <select id="js-layers" class="layers"> <option value="-10527519,3160212,4">Temperature (USA)</option> <option value="-408479,7213209,6">Bedrock (UK)</option> </select> </div> - Create the map instance with the default OpenStreetMap layer:
var map = new ol.Map({ view: new ol.View({ zoom: 4, center: [-10527519, 3160212] }), target: 'js-map', layers: [ new ol.layer.Tile({ source: new ol.source.OSM() }) ] }); - Add the first WMS layer to the map:
map.addLayer(new ol.layer.Tile({ source: new ol.source.TileWMS({ url: 'http://gis.srh.noaa.gov/arcgis/services/' + 'NDFDTemps/MapServer/WMSServer', params: { LAYERS: 16, FORMAT: 'image/png', TRANSPARENT: true }, attributions: [ new ol.Attribution({ html: 'Data provided by the ' + '<a href="http://noaa.gov">NOAA</a>.' }) ] }), opacity: 0.50 })); - Add the second WMS layer to the map:
map.addLayer(new ol.layer.Tile({ source: new ol.source.TileWMS({ url: 'http://ogc.bgs.ac.uk/cgi-bin/' + 'BGS_Bedrock_and_Superficial_Geology/wms', params: { LAYERS: 'BGS_EN_Bedrock_and_Superficial_Geology' }, attributions: [ new ol.Attribution({ html: 'Contains <a href="http://bgs.ac.uk">' + 'British Geological Survey</a> ' + 'materials © NERC 2015' }) ] }), opacity: 0.85 })); - Finally, add the layer-switching logic:
document.getElementById('js-layers')
  .addEventListener('change', function() {
    var values = this.value.split(',');
    var view = map.getView();
    view.setCenter([
      parseFloat(values[0]),
      parseFloat(values[1])
    ]);
    view.setZoom(values[2]);
});
The HTML and CSS divide the page into two sections: one for the map, and the other for the layer-switching panel. The top part of our custom JavaScript file creates a new map instance with a single OpenStreetMap layer—this layer will become the background for the WMS layers in order to provide some context.
Let's spend the rest of our time concentrating on how the WMS layers are created.
WMS layers are encapsulated within the ol.layer.Tile layer type. The source is an instance of ol.source.TileWMS, which is a subclass of ol.source.TileImage. The ol.source.TileImage class is behind many source types that we've already covered in this chapter, such as Bing Maps, and custom OpenStreetMap layers that are based on XYZ format.
When using ol.source.TileWMS, we must at least pass in the URL of the WMS server and a layers parameter. Let's breakdown the first WMS layer as follows:
map.addLayer(new ol.layer.Tile({
  source: new ol.source.TileWMS({
    url: 'http://gis.srh.noaa.gov/arcgis/services/NDFDTemps/' +
    'MapServer/WMSServer',
    params: {
      LAYERS: 16,
      FORMAT: 'image/png',
      TRANSPARENT: true
    },
    attributions: [
      new ol.Attribution({
        html: 'Data provided by the ' +
        '<a href="http://noaa.gov">NOAA</a>.'
      })
    ]
  }),
  opacity: 0.50
}));
For the url property of the source, we provide the URL of the WMS server from NOAA (http://www.noaa.gov).
The params property expects an object of key/value pairs. The content of which is appended to the aforementioned URL as query string parameters, for example, http://gis.srh.noaa.gov/arcgis/services/NDFDTemps/MapServer/WMSServer?LAYERS=16.
As mentioned earlier, this object requires, at minimum, the LAYERS property with a value. We request for the layer by the name of 16. Along with this parameter, we also explicitly ask for the tile images to be in the .PNG format (FORMAT: 'image/png') and that the background of the tiles be transparent (TRANSPARENT: true), rather than white, which would undesirably block out the background map layer.
There are also other parameters OpenLayers fills in for you if not specified, such as service (WMS), version (1.3.0), request (GetMap) and so on.
For the attributions property we have created a new attribution instance to cover our usage of the WMS service, which simply contains a string of HTML linking back to the NOAA website.
Lastly, we set the opacity property of the layer to 50% (0.50), which suitably overlays the OpenStreetMap layer underneath.
map.addLayer(new ol.layer.Tile({
source: new ol.source.TileWMS({
url: 'http://ogc.bgs.ac.uk/cgi-bin/' +
'BGS_Bedrock_and_Superficial_Geology/wms',
params: {
LAYERS: 'BGS_EN_Bedrock_and_Superficial_Geology'
},
attributions: [
new ol.Attribution({
html: 'Contains <a href="http://bgs.ac.uk">' +
'British Geological Survey</a> ' +
'materials © NERC 2015'
})
]
}),
opacity: 0.85
}));This layer from the British Geological Survey (http://bgs.ac.uk) follows the same structure as the previous WMS layer. Similarly, we provided a source URL and a layers parameter for the HTTP request. The layer name is a string rather than a number this time, delimited by underscores. The naming convention is at the discretion of the WMS service itself.
As well as before, an attribution instance has been added to the layer, which contains a string of HTML linking back to the BGS website, covering our usage of the WMS service.
The opacity property of this layer is a little less transparent than the last one, at 85% (0.85).
document.getElementById('js-layers')
  .addEventListener('change', function() {
    var values = this.value.split(',');
    var view = map.getView();
    view.setCenter([
      parseFloat(values[0]),
      parseFloat(values[1])
    ]);
    view.setZoom(values[2]);
  });
Finally, we added a change-event listener and handler to the select menu containing both the WMS layers. If you recall from the HTML, an option's value contains a comma-delimited string. For example, the Bedrock WMS layer option looks like this:
<option value="-408479,7213209,6">Bedrock (UK)</option>
This translates to x coordinate, y coordinate, and zoom level.
With this in mind when the change event fires, we store the value of the newly-selected option in a variable named values. The split JavaScript method creates a three item array from the string. The array now contains the xy coordinates and the zoom level, respectively.
We store a reference to the view into a variable, namely view, as it's accessed more than once within the event handler.
The map view is then centered to the new location with the setCenter method. We've made sure to convert the string values into float types for OpenLayers, via the parseFloat JavaScript method. The zoom level is then set via the setZoom method.
Continuing with the Bedrock example, it will recenter at -408479, 7213209 with zoom level 6.
Integrating with custom WMS services plays an essential role in many web mapping applications. Learning how we did it in this recipe should give you a good idea of how to integrate with any other WMS services that you might use.
It's worth mentioning that WMS services do not necessarily cover a global extent, and will more likely cover only subset extents of the world. Case in point, the NOAA WMS layer covers only the USA, and the BGS WMS layer only covers the UK.
During this topic, we only looked at the request type of GetMap, but there's also a request type called GetCapabilities. Using the GetCapabilities request parameter on the same URL endpoint returns what capabilities (such as extent) a WMS server supports.
If you don't specify the type of projection, the view default projection will be used. In our case this will be EPSG:3857, which is passed up in a parameter named CRS (it's named SRS for the GetMap version requests less than 1.3.0). If you want to retrieve WMS tiles in different projections, you need to ensure the WMS server supports that particular format.
WMS servers return images no matter whether there is information in the bounding box being requested or not. Taking this recipe as an example, if the viewable extent of the map is only the UK, blank images will get returned for WMS layer requests made for the USA (via the NOAA tile requests). You can prevent these unnecessary HTTP requests by setting the visibility of any layers to false that do not cover the extent of the area being viewed.
There are some useful methods of the ol.source.TileWMS class that are worth being aware of, such as updateParams, which can be used to set parameters for the WMS request, and getUrls, which returns the URLs used for the WMS source.