Table of Contents for
OpenLayers 3.x Cookbook - Second Edition
 OpenLayers 3.x Cookbook - Second Edition
Published by
Packt Publishing, 2016
OpenLayers 3.x Cookbook - Second Edition
Published by
Packt Publishing, 2016
- Cover
- Table of Contents
- OpenLayers 3.x Cookbook Second Edition
- OpenLayers 3.x Cookbook Second Edition
- Credits
- About the Authors
- About the Reviewer
- www.PacktPub.com
- Preface
- What you need for this book
- Who this book is for
- Sections
- Conventions
- Reader feedback
- Customer support
- 1. Web Mapping Basics
- Creating a simple fullscreen map
- Playing with the map's options
- Managing the map's stack layers
- Managing the map's controls
- Moving around the map view
- Restricting the map's extent
- 2. Adding Raster Layers
- Using Bing imagery
- Using OpenStreetMap imagery
- Adding WMS layers
- Changing the zoom effect
- Changing layer opacity
- Buffering the layer data to improve map navigation
- Creating an image layer
- Setting the tile size in WMS layers
- 3. Working with Vector Layers
- Adding a GML layer
- Adding a KML layer
- Creating features programmatically
- Exporting features as GeoJSON
- Reading and creating features from a WKT
- Using point features as markers
- Removing or cloning features using overlays
- Zooming to the extent of a layer
- Adding text labels to geometry points
- Adding features from a WFS server
- Using the cluster strategy
- Reading features directly using AJAX
- Creating a heat map
- 4. Working with Events
- Creating a side-by-side map comparator
- Implementing a work-in-progress indicator for map layers
- Listening for the vector layer features' events
- Listening for mouse or touch events
- Using the keyboard to pan or zoom
- 5. Adding Controls
- Adding and removing controls
- Working with geolocation
- Placing controls outside the map
- Drawing features across multiple vector layers
- Modifying features
- Measuring distances and areas
- Getting feature information from a data source
- Getting information from a WMS server
- 6. Styling Features
- Styling layers
- Styling features based on geometry type
- Styling based on feature attributes
- Styling interaction render intents
- Styling clustered features
- 7. Beyond the Basics
- Working with projections
- Creating a custom control
- Selecting features by dragging out a selection area
- Transitioning between weather forecast imagery
- Using the custom OpenLayers library build
- Drawing in freehand mode
- Modifying layer appearance
- Adding features to the vector layer by dragging and dropping them
- Making use of map permalinks
- Index
When you create a map to visualize data, there are some important things that you need to take into account: the projection to use, the available zoom levels, the default tile size to be used by the layer requests, and so on. Most of these important pieces are enclosed in the map's properties.
This recipe shows you how to set some common map properties. You can find the source code for this recipe in ch01/ch01-map-options/.
When you instantiate a new ol.Map instance, you have the option to pass in all the properties as an object literal—this is what we did in the first recipe. In the next recipe, you will take a look at a different way of achieving a similar result through the use of setter methods.
- Just like we did in the first recipe, create an HTML page to house the map, include the OpenLayers dependencies and, add our custom CSS and JavaScript files. This time, place the following CSS into your custom style sheet:
.map { position: absolute; top: 0; bottom: 0; left: 0; right: 0; } .ol-mouse-position { top: inherit; bottom: 8px; left: 8px; background-color: rgba(255,255,255,0.4); border-radius: 2px; width: 100px; text-align: center; font-family: Arial, sans-serif; font-size: 12px; } - Put the following in your custom JavaScript file:
var map = new ol.Map({
  layers: [
    new ol.layer.Tile({
      source: new ol.source.OSM()
    })
  ]
});

var mousePositionControl = new ol.control.MousePosition({
  coordinateFormat: ol.coordinate.createStringXY(2),
  projection: 'EPSG:4326'
});

map.addControl(mousePositionControl);
map.setTarget('js-map');

var view = new ol.View({
  zoom: 4,
  projection: 'EPSG:3857',
  maxZoom: 6,
  minZoom: 3,
  rotation: 0.34 // 20 degrees
});

view.setCenter([-10800000, 4510000]);

map.setView(view);
If you now open this file up in your browser, you'll see something similar to the following screenshot:
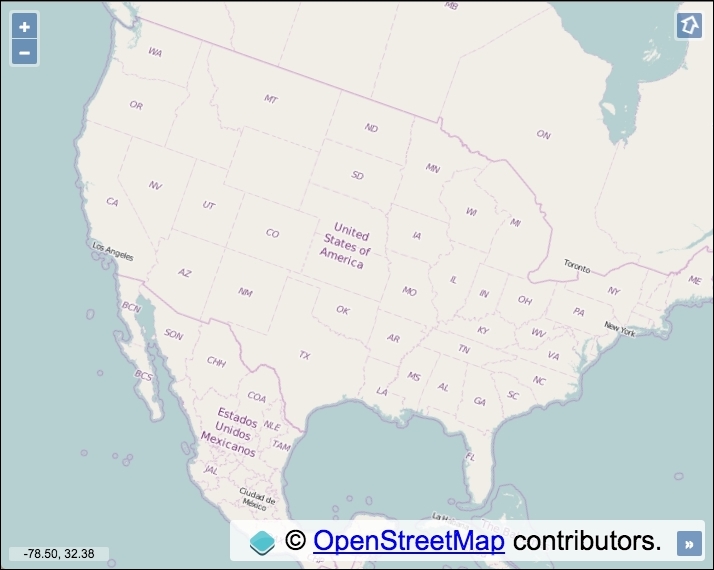
Aside from the CSS to create the fullscreen map, we've also added some new CSS rules that style the mouse position control on the map (bottom-left). This demonstrates the ease of styling map controls with a bit of simple CSS. The default class name for the mouse position control is .ol-mouse-position, which we use to override the default CSS.
We've introduced some new methods and properties in this recipe, so let's go over the JavaScript together:
var map = new ol.Map({
  layers: [
    new ol.layer.Tile({
      source: new ol.source.OSM()
    })
  ]
});
When instantiating a new instance of ol.Map, we've passed in only the layers property at this point and saved a reference to the map instance in a variable named map.
var mousePositionControl = new ol.control.MousePosition({
  coordinateFormat: ol.coordinate.createStringXY(2),
  projection: 'EPSG:4326'
});
There's quite a bit going on in this snippet of JavaScript that we haven't seen before. When instantiating this new mouse position control, we passed in an object containing some additional settings.
The coordinateFormat property allows us to alter how the coordinates are displayed. This property expects an ol.CoordinateFormatType function that can be used to format an ol.coordinate array to a string. In other words, the ol.coordinate.createStringXY function returns the expected function type and formats the coordinates into a string, which we see onscreen. We specify the number of digits to include after the decimal point to 2. Coordinates can get rather long, and we're not concerned with the level of accuracy here!
Let's take a look at the next property, projection. This tells OpenLayers to display the coordinates in the EPSG:4326 projection. However, the default map projection is EPSG:3857. Due to this difference, OpenLayers must transform the projection from one type to another behind the scenes. If you were to remove this property from the control, it'll inherit the default map projection and you'll be presented with very different looking coordinates (in the EPSG:3857 projection).
The EPSG:4326 and EPSG:3857 projections are boxed up with OpenLayers as standard. When you start dealing with other worldwide projections, you'll need to manually include the projection conversions yourself. Don't worry because there's a library for exactly this purpose, and we'll cover this later in this book.
map.addControl(mousePositionControl);
We then add the mouse position control to the map instance using the addControl method. This implicitly extends the default map controls.
map.setTarget('js-map');We use one of the map setter methods to add the target property and value.
var view = new ol.View({
  zoom: 4,
  projection: 'EPSG:3857',
  maxZoom: 6,
  minZoom: 3,
  rotation: 0.34 // 20 degrees
});
We've introduced some new view properties with this instantiation of the view: projection, maxZoom, minZoom, and rotation.
The projection option is used to set the projection that is used by the map view to render data from layers. The projection of EPSG:3857 actually matches the default projection, and it is also the projection that OpenStreetMap uses (which is important, as you need to be sure that the tile service accepts the type of projection). We've explicitly set it here only for demonstration purposes.
Setting the maxZoom and minZoom properties creates a restricted zoom range. This means that the user can only view a subset of the available zoom levels. In this case, they cannot zoom further out than zoom level 3, and further in than zoom level 6.
The rotation property rotates the map by a specified amount in radians. You'll notice that once you've set a rotation, OpenLayers automatically adds a rotation control to the map. In the case of this example, it appeared at the top-right. If you're feeling disorientated you can click this button and it will reset the map rotation back to 0 for you.
view.setCenter([-10800000, 4510000]);
As we stored the view instance in a variable, we can easily add additional properties just like we did for the map instance. Here, we use a setter method on view to set the initial center position of the map.
map.setView(view);
Finally, we add the completed view instance to the map instance using another helpful map method, setView.
Note
For projections other than EPSG:4326 and EPSG:3857, you need to include the Proj4js project (http://proj4js.org) in your web application. This is discussed later in this book.
EPSG codes are a way to name and classify the set of available projections. The site Coordinate Systems Worldwide (http://epsg.io/) is a great place to find more information about them.
The EPSG:4326 projection is also known as WGS84, which is measured in degree units. The EPSG:3857 projection is also know as Spherical Mercator, which is in meter unit coordinates.
Imagery from sources such as Google Maps or OpenStreetMap are special cases where the pyramid of images is previously created with the Spherical Mercator projection—EPSG:3857. This means that you can't set the projection when requesting tiles because it is implicit.
If you put a layer in a different projection other than the one used by the map view, then it won't work as expected.
Note
Services such as Google Maps and OpenStreetMap have prerendered rasterized images or tiles, that make up the extent of the world. This saves servers from rendering images on demand, which means that more requests can be processed in a timely manner. The images form a pyramid tiling pattern, whereby at the smallest scale, there are fewer tiles (top of the pyramid), and as the scale is increased, more tiles make up the region (bottom of the pyramid). You can find a good explanation and also some interesting history behind this pattern's inception here: https://www.e-education.psu.edu/geog585/node/706.
- The Managing the map's stack layers recipe
- The Managing the map's controls recipe
- The Working with projections recipe in Chapter 7, Beyond the Basics.