Table of Contents for
OpenLayers 3.x Cookbook - Second Edition
 OpenLayers 3.x Cookbook - Second Edition
Published by
Packt Publishing, 2016
OpenLayers 3.x Cookbook - Second Edition
Published by
Packt Publishing, 2016
- Cover
- Table of Contents
- OpenLayers 3.x Cookbook Second Edition
- OpenLayers 3.x Cookbook Second Edition
- Credits
- About the Authors
- About the Reviewer
- www.PacktPub.com
- Preface
- What you need for this book
- Who this book is for
- Sections
- Conventions
- Reader feedback
- Customer support
- 1. Web Mapping Basics
- Creating a simple fullscreen map
- Playing with the map's options
- Managing the map's stack layers
- Managing the map's controls
- Moving around the map view
- Restricting the map's extent
- 2. Adding Raster Layers
- Using Bing imagery
- Using OpenStreetMap imagery
- Adding WMS layers
- Changing the zoom effect
- Changing layer opacity
- Buffering the layer data to improve map navigation
- Creating an image layer
- Setting the tile size in WMS layers
- 3. Working with Vector Layers
- Adding a GML layer
- Adding a KML layer
- Creating features programmatically
- Exporting features as GeoJSON
- Reading and creating features from a WKT
- Using point features as markers
- Removing or cloning features using overlays
- Zooming to the extent of a layer
- Adding text labels to geometry points
- Adding features from a WFS server
- Using the cluster strategy
- Reading features directly using AJAX
- Creating a heat map
- 4. Working with Events
- Creating a side-by-side map comparator
- Implementing a work-in-progress indicator for map layers
- Listening for the vector layer features' events
- Listening for mouse or touch events
- Using the keyboard to pan or zoom
- 5. Adding Controls
- Adding and removing controls
- Working with geolocation
- Placing controls outside the map
- Drawing features across multiple vector layers
- Modifying features
- Measuring distances and areas
- Getting feature information from a data source
- Getting information from a WMS server
- 6. Styling Features
- Styling layers
- Styling features based on geometry type
- Styling based on feature attributes
- Styling interaction render intents
- Styling clustered features
- 7. Beyond the Basics
- Working with projections
- Creating a custom control
- Selecting features by dragging out a selection area
- Transitioning between weather forecast imagery
- Using the custom OpenLayers library build
- Drawing in freehand mode
- Modifying layer appearance
- Adding features to the vector layer by dragging and dropping them
- Making use of map permalinks
- Index
OpenStreetMap (http://www.openstreetmap.org) is built by an open community of mappers who contribute and maintain geospatial data. This means that even you and I can get involved if we want to! This data is openly available to the public as long as you provide credit to OpenStreetMap and its contributors.
In earlier recipes, we only took a look at the standard layer type from OpenStreetMap, but there are many, many more layer styles that have been created on top of the OpenStreetMap data. We will show you three different OpenStreetMap sources: Humanitarian OSM, MapQuest Open, and Transport Dark OSM.
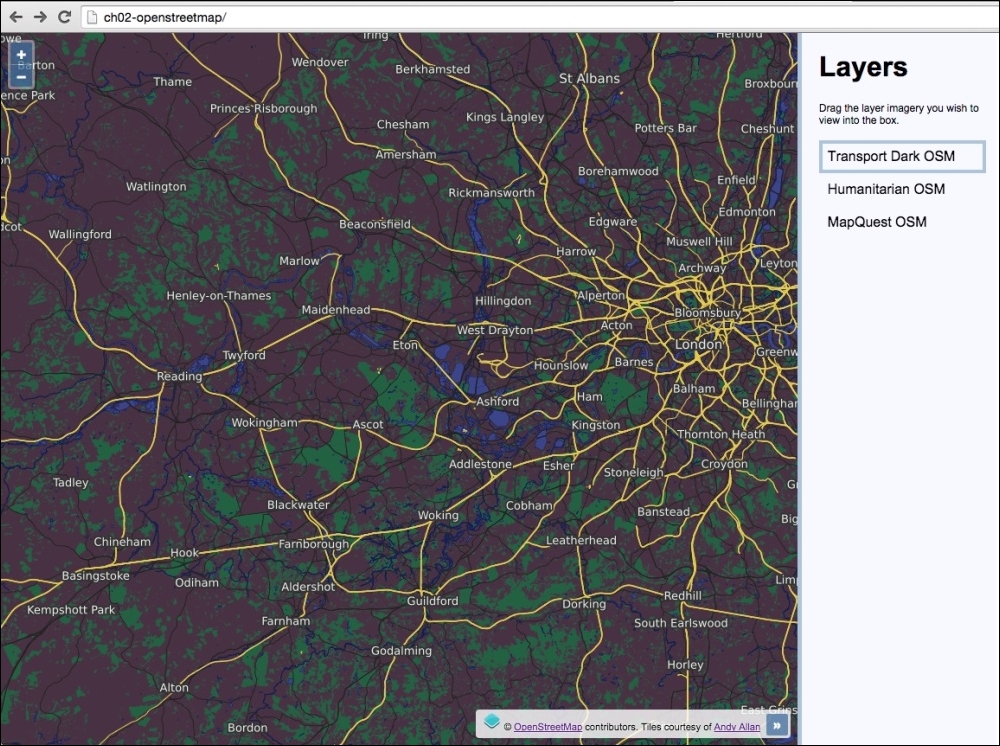
The preceding map shows the Transport Dark OpenStreetMap layer style from Andy Allen. The source code for this recipe can be found in ch02/ch02-openstreetmap/.
Let's produce this recipe using the steps outlined as follows:
- Create the HTML page with OpenLayers dependencies, jQuery and jQuery UI. In particular, split the page into two sections for the map and layer switching panel:
<div id="js-map" class="map"></div>
<div class="pane">
  <h1>Layers</h1>
  <p>Drag the layer imagery you wish to view into the box.</p>
  <ul id="js-layers"></ul>
</div>
- In your custom JavaScript file, create a new map instance:
var map = new ol.Map({ view: new ol.View({ zoom: 4, center: [4158174, 4392988] }), target: 'js-map' }); - Create the first OpenStreetMap layer, Humanitarian, and add it to the map:
map.addLayer(new ol.layer.Tile({ source: new ol.source.OSM({ attributions: [ new ol.Attribution({ html: 'Tiles courtesy of ' + '<a href="http://hot.openstreetmap.org">' + 'Humanitarian OpenStreetMap Team</a>' }), ol.source.OSM.ATTRIBUTION ], url: 'http://{a- c}.tile.openstreetmap.fr/hot/{z}/{x}/{y}.png' }), title: 'Humanitarian OSM' })); - Create the MapQuest OpenStreetMap layer and add it to the map:
map.addLayer(new ol.layer.Tile({ source: new ol.source.OSM({ attributions: [ new ol.Attribution({ html: 'Tiles courtesy of ' + '<a href="http://www.mapquest.com/">MapQuest</a>' + '<img src="https://developer.mapquest.com/' + 'content/osm/mq_logo.png">' }), ol.source.OSM.ATTRIBUTION ], url: 'http://otile{1-3}.mqcdn.com/tiles/1.0.0/' + 'osm/{z}/{x}/{y}.png' }), title: 'MapQuest OSM', visible: false })); - Create the final layer of Transport Dark OpenStreetMap and add it to the map:
map.addLayer(new ol.layer.Tile({ source: new ol.source.OSM({ attributions: [ new ol.Attribution({ html: 'Tiles courtesy of ' + '<a href="http://www.thunderforest.com">Andy Allan</a>' }), ol.source.OSM.ATTRIBUTION ], url: 'http://{a-c}.tile.thunderforest.com/transport- dark/' +'{z}/{x}/{y}.png' }), title: 'Transport Dark OSM', visible: false })); - Dynamically populate the list of layers in the UI, as follows:
var $layersList = $('#js-layers'); map.getLayers().forEach(function(element) { var $li = $('<li />'); $li.text(element.get('title')); $layersList.append($li); }); - Add the logic to switch layers with the help of jQuery UI:
$layersList.sortable({
  update: function() {
    var topLayer = $layersList.find('li:first-child').text();

    map.getLayers().forEach(function(element) {
      element.setVisible(element.get('title') === topLayer);
    });
  }
});
This is the first recipe so far in this book that has seen layer creation with such granularity. We've declared properties, such as custom URLs, and attributions, for the first time.
We'll gloss over the more familiar parts of this recipe, such as the HTML, CSS, and JavaScript, to create the map instance and layer switching with jQueryUI so that we can take a deeper look at the newer components of this recipe: the OpenStreetMap layers:
map.addLayer(new ol.layer.Tile({
  source: new ol.source.OSM({
    attributions: [
      new ol.Attribution({
        html: 'Tiles courtesy of ' +
              '<a href="http://hot.openstreetmap.org">' +
              'Humanitarian OpenStreetMap Team</a>'
      }),
      ol.source.OSM.ATTRIBUTION
    ],
    url: 'http://{a-c}.tile.openstreetmap.fr/hot/' +
         '{z}/{x}/{y}.png'
  }),
  title: 'Humanitarian OSM'
}));
As the three layers follow the same pattern, we'll thoroughly walk through the first layer instantiation only, then simply point out any noteworthy differences against the other two layers.
We create the new ol.layer.Tile instance within the addLayer method for convenience. Our tile layer source is an instance of the built-in OpenStreetMap source (ol.source.OSM), which we pass a configuration object into.
The first property of the configuration object that we customize is attributions. This property expects an array of many ol.Attribution instances. The list of attributions gives credit to the appropriate parties, and this means that we adhere to the terms of usage. The content that we put in here makes up the attributions map control content (placed bottom-right of the map as standard).
The ol.Attribution constructor just requires a string of HTML to be passed in via the html property. We've populated a string of HTML that covers our usage of the Humanitarian OpenStreetMap layer. Concatenation of the string has been used to break it up over multiple lines for readability.
The second item in the attributions array (ol.source.OSM.ATTRIBUTION) is an already prepared instance of ol.Attribution from OpenLayers that contains the following HTML: '© <a href="http://www.openstreetmap.org/copyright">OpenStreetMap</a> contributors.'. This is what gets implicitly added whenever you use ol.source.OSM() without supplying any custom attributions yourself.
The url property contains a string, which has the endpoint for the HTTP tile requests for this layer. You'll notice some curly braces within the string. These are template placeholders, which will be replaced by meaningful values for the request by OpenLayers.
This tile service supports three sub subdomains, namely a, b, or c. The {a-c} attribute is replaced with a letter within the range at random. So, our tile requests could go out to a.tile.openstreetmap.org, b.tile.openstreetmap.org or c.tile.openstreetmap.org. The {x}, {y} and {z} attributes are also replaced by OpenLayers with the relevant grid coordinates to complete the request URL.
Using a template string, we can avoid having to pass in multiple URLs for differently named subdomains. However, if it's necessary for you to manually pass in multiple URLs, then you can alternatively use the urls property with an array of URL strings instead.
Finally, for the ol.layer.Tile options, we provide a custom title for this layer so that we can use it for display in the UI and also for some layer matching logic later on.
We go on to create another two OpenStreetMap based layers: MapQuest Open, and Transport Dark. These layers follow the same blueprint. Note that we set the visibility of these layers to false, as we only want to display one layer at a time.
Once all the layers are in place, we dynamically populate the list of layers in the HTML and add some logic to show or hide layers depending on their position in the list. We won't go into detail about how this works, as this has been properly discussed during earlier recipes.
The ol.source.OSM class is a subclass of ol.source.XYZ. This particular source type is for tile data with URLs in a set XYZ format that we saw defined in the string template. This structure follows the widely-used Google grid system. The ol.source.XYZ class provides some additional properties such as projection and methods, such as setUrl.
There are many more uniquely-designed tile services built on top of OpenStreetMap data, and this book simply can't demonstrate them all. The OpenStreetMap community is vibrant and creative, and I'm sure there will be lots more choice to come. I encourage you to take a look at the OpenStreetMap collection from http://www.thunderforest.com and the Stamen collection at http://maps.stamen.com, and then go expand your searches even further.
Big mapping companies, such as MapQuest, have embraced OpenStreetMap data and shown their support by openly providing great layers we can consume, like the one seen in this recipe. If you're interested to learn more about MapQuest, visit this informational link that provides some further insight: http://wiki.openstreetmap.org/wiki/MapQuest.