Table of Contents for
Mastering OpenLayers 3
 Mastering OpenLayers 3
Published by
Packt Publishing, 2016
Mastering OpenLayers 3
Published by
Packt Publishing, 2016
- Cover
- Table of Contents
- Mastering OpenLayers 3
- Mastering OpenLayers 3
- Credits
- About the Author
- About the Reviewer
- www.PacktPub.com
- Preface
- What you need for this book
- Who this book is for
- Conventions
- Reader feedback
- Customer support
- 1. Creating Simple Maps with OpenLayers 3
- Structure of OpenLayers 3
- Building the layout
- Using the API documentation
- Debugging the code
- Summary
- 2. Applying Custom Styles
- Customizing the default appearance
- Styling vector layers
- Customizing the appearance with JavaScript
- Creating a WebGIS client layout
- Summary
- 3. Working with Layers
- Building a layer tree
- Adding layers dynamically
- Adding vector layers with the File API
- Adding vector layers with a library
- Removing layers dynamically
- Changing layer attributes
- Changing the layer order with the Drag and Drop API
- Clearing the message bar
- Summary
- 4. Using Vector Data
- Accessing attributes
- Setting attributes
- Validating attributes
- Creating thematic layers
- Saving vector data
- Saving with WFS-T
- Modifying the geometry
- Summary
- 5. Creating Responsive Applications with Interactions and Controls
- Building the toolbar
- Mapping interactions to controls
- Building a set of feature selection controls
- Adding new vector layers
- Building a set of drawing tools
- Modifying and snapping to features
- Creating new interactions
- Building a measuring control
- Summary
- 6. Controlling the Map – View and Projection
- Customizing a view
- Constraining a view
- Creating a navigation history
- Working with extents
- Rotating a view
- Changing the map's projection
- Creating custom animations
- Summary
- 7. Mastering Renderers
- Using different renderers
- Creating a WebGL map
- Drawing lines and polygons with WebGL
- Blending layers
- Clipping layers
- Exporting a map
- Creating a raster calculator
- Creating a convolution matrix
- Clipping a layer with WebGL
- Summary
- 8. OpenLayers 3 for Mobile
- Responsive styling with CSS
- Generating geocaches
- Adding device-dependent controls
- Vectorizing the mobile version
- Making the mobile application interactive
- Summary
- 9. Tools of the Trade – Integrating Third-Party Applications
- Exporting a QGIS project
- Importing shapefiles
- Spatial analysis with Turf
- Spatial analysis with JSTS
- 3D rendering with Cesium
- Summary
- 10. Compiling Custom Builds with Closure
- Configuring Node JS
- Compiling OpenLayers 3
- Bundling an application with OpenLayers 3
- Extending OpenLayers 3
- Creating rich documentation with JSDoc
- Summary
- Index
In our final example, called ch09_cesium, we will integrate Cesium into our application. Cesium is a 3D web mapping application, capable of rendering ordinary OWS layers and features on a globe and creating DEM visualizations with elevation tiles. It can display various spatial data in 2D and 3D, knows some projections, and on top of visualizing elevation data, it can also render 3D objects using various 3D-capable formats.
The only problem with Cesium is that it would be very hard to synchronize with OpenLayers 3. Luckily, the OpenLayers 3 developer team created an integration library, which can utilize the 3D capabilities of Cesium. The downside of this approach is the limitation of the capabilities of Cesium. We can use the 3D renderer, Web Mercator, and the WGS84 projections (EPSG:3857 and EPSG:4326), and we can access the currently used Cesium scene. The library automatically synchronizes the scene with our OpenLayers 3 map, and if we know how to use Cesium, we can also use some Cesium-only features with the object of the exposed scene.
First, we include the Cesium and OL3-Cesium libraries in our HTML file. We must include both of the libraries, but in this case, theoretically, the order does not matter. However, loading Cesium before OL3-Cesium is the least error-prone; therefore, we will do this.
Note
OL3-Cesium ships with the exact versions of OpenLayers 3 and Cesium that it was compiled against. On the top of this, from OL3-Cesium 1.10.0, OpenLayers 3 is bundled in ol3cesium.js. This way, we do not have to include ol.js in a script tag. The integration library will be error-free when we use it with the proper OpenLayers 3 and Cesium versions. However, if we want to use a custom version that is compatible with the given OL3-Cesium version, we can do this by including our custom library after OL3-Cesium.
<head>
    […]
    <script type="text/javascript" src="../../js/ol3-cesium-1.10.0/Cesium/Cesium.js"></script>
    <script type="text/javascript" src="../../js/ol3-cesium-1.10.0/ol3cesium.js"></script>
    <script type="text/javascript" src="ch09_cesium.js"></script>
</head>
Next, we load some additional layers in our JavaScript file to test the rendering capabilities of the library. We will use MapQuest's OpenStreetMap layer because it has some nice hillshade effects. As an overlay, we will use a GeoJSON point layer containing capitals. We will use a marker to represent these capitals instead of the default blue circles:
var map = new ol.Map({
    target: 'map',
    layers: [
        new ol.layer.Tile({
            source: new ol.source.MapQuest({
                layer: 'osm'
            }),
            name: 'MapQuest'
        }),
        new ol.layer.Vector({
            source: new ol.source.Vector({
                format: new ol.format.GeoJSON({
                    defaultDataProjection: 'EPSG:4326'
                }),
                url: '../../res/world_capitals.geojson'
            }),
            name: 'World Capitals',
            style: new ol.style.Style({
                image: new ol.style.Icon({
                    anchor: [0.5, 46],
                    anchorXUnits: 'fraction',
                    anchorYUnits: 'pixels',
                    src: '../../res/marker.png'
                })
            })
        })
    ],
    […]
});
var tree = new layerTree({map: map, target: 'layertree', messages: 'messageBar'})
    .createRegistry(map.getLayers().item(0))
    .createRegistry(map.getLayers().item(1));
For the images representing the capital cities, we used some extra parameters for styling. The anchor property represents the offset of the image. As OpenLayers 3 snaps the upper-left corner of the image to the feature, we define an offset, and thus the cusp of the marker is snapped to the capital it represents. We can use different units for different dimensions, therefore we also define them as extra parameters. The preceding style definition indicates that the library should offset the image by 50% (0.5 fraction) to the left and 46 pixels upward (the height of the image is 48 pixels).
Next, we continue creating the control. First, as usual, we create the element of the control and parameterize it correctly:
ol.control.Cesium = function (opt_options) {
    var options = opt_options || {};
    var _this = this;
    var controlDiv = document.createElement('div');
    controlDiv.className = options.class || 'ol-cesium ol-unselectable ol-control';
The next step is to initialize the 3D visualization of our map. The only problem with this is that the OL3-Cesium library requires the map object to read out the layers and view properties. However, if we provide the control in the map's constructor, we will not have the map object yet when this code block is run. To avoid such errors, we call this part of the code asynchronously; thus, we put the construction of the Cesium scene after the construction of the map object.
The initialization of the Cesium scene via OL3-Cesium is quite automatic. We only have to define one thing: the source of the elevation tiles. By default, Cesium can use two kinds of elevation formats: quantized mesh and height map. Both of these formats are supported by the CesiumTerranProvider constructor:
    setTimeout(function () {
        var ol3d = new olcs.OLCesium({map: _this.getMap()});
        var scene = ol3d.getCesiumScene();
        scene.terrainProvider = new Cesium.CesiumTerrainProvider({
            url: 'http://assets.agi.com/stk-terrain/world'
        });
        _this.set('cesium', ol3d);
    }, 0);
Next, we create the control button and define its click event. We can easily read the status of the visualization; therefore, we can enable or disable it according to its status. The only extra command we include is the setBlockCesiumRendering method. When we disable the visualization, we also block the dynamic rendering of the current viewport in Cesium. This consideration improves the performance of the 2D application but makes the rendering longer when we activate the 3D visualization:
    var controlButton = document.createElement('button');
    controlButton.textContent = '3D';
    controlButton.title = 'Toggle 3D rendering';
    controlButton.addEventListener('click', function (evt) {
        var cesium = _this.get('cesium');
        if (cesium.getEnabled()) {
            cesium.setBlockCesiumRendering(true);
            cesium.setEnabled(false);
        } else {
            cesium.setBlockCesiumRendering(false);
            cesium.setEnabled(true);
        }
    });
Finally, we close our control in the usual way and add it to the map:
controlDiv.appendChild(controlButton);
ol.control.Control.call(this, {
element: controlDiv,
target: options.target
});
};
ol.inherits(ol.control.Cesium, ol.control.Control);
[…]
var map = new ol.Map({
[…]
controls: [
[…]
new ol.control.Cesium({
target: 'toolbar'
})
],
[…]
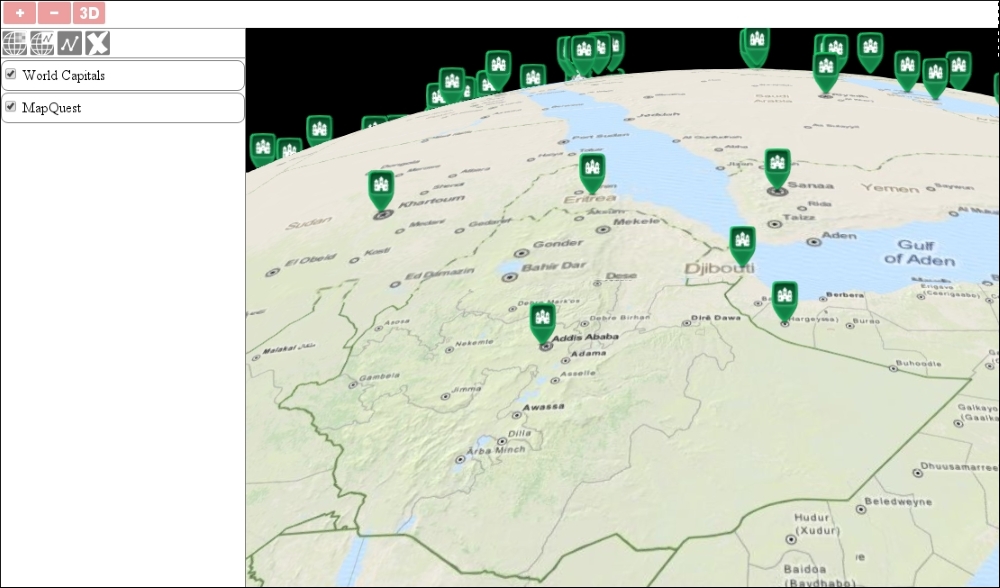
});If you load the example and enable 3D rendering, you can browse the capitals on the globe and have a nice visualization of the terrain due to the elevation tiles and shaded base layer. You can also check how the atmosphere is rendered in Cesium:
Now that we have taken a look at the 3D visualization of our map on a global scale, let's also examine the minor details of it. There is another example, called ch09_cesium_terrain, in which we will load some more layers. First, we extend our map with two more layers. The first one is the topological map of the Grand Canyon, while the second is a vector layer in TopoJSON, representing the major rivers on the Earth:
var map = new ol.Map({
    target: 'map',
    layers: [
        […]
        new ol.layer.Tile({
            source: new ol.source.XYZ({
                url: 'http://tileserver.maptiler.com/grandcanyon/{z}/{x}/{y}.png'
            }),
            name: 'Grand Canyon'
        }),
        new ol.layer.Vector({
            source: new ol.source.Vector({
                format: new ol.format.TopoJSON({
                    defaultDataProjection: 'EPSG:4326'
                }),
                url: '../../res/rivers.topojson'
            }),
            name: 'Rivers',
            altitudeMode: 'clampToGround'
        }),
        […]
Next, as we do not expect anyone to know the coordinates of the Grand Canyon, we center our view in this way:
    […]
    view: new ol.View({
        center: [-12488000, 4308000],
        zoom: 12
    })
});
We also add our new layers to the layer tree for a nice visual feedback:
var tree = new layerTree({map: map, target: 'layertree', messages: 'messageBar'})
    .createRegistry(map.getLayers().item(0))
    .createRegistry(map.getLayers().item(1))
    .createRegistry(map.getLayers().item(2))
    .createRegistry(map.getLayers().item(3));
Now, if you load the extended example and enable 3D rendering, you will see the Grand Canyon's terrain with the topological map and shaded MapQuest layer draped around it:
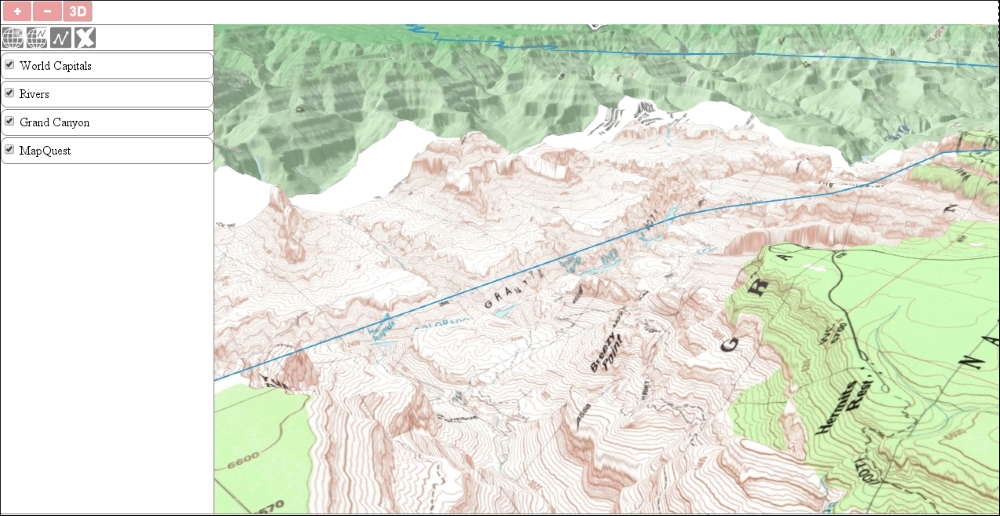
Tip
As you can see, there is one odd thing in the composition. The Colorado River is not masked by the terrain. There is an option in Cesium to create geometries, which are draped around the terrain, and a depth test is executed against them. You can invoke this option even from OL3-Cesium by adding a property to a vector layer, named altitudeMode, and setting its value to clampToGround. However, Cesium does not support draping line geometries yet, just polygons. Alternatively, you can set the globe.depthTestAgainstTerrain property of the Cesium scene to true, but you will need a vector layer with altitude data for this to work correctly.
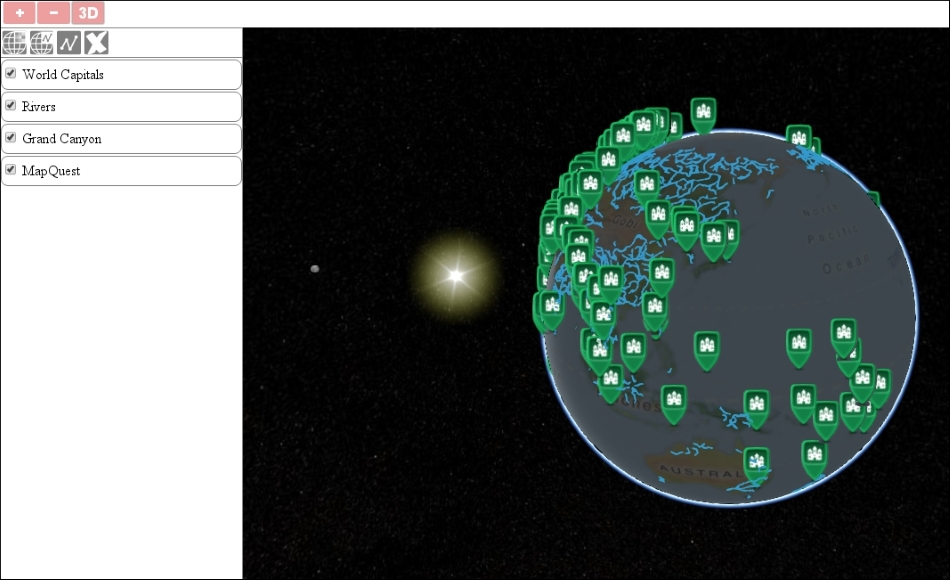
In the final task, let's look into what we can do easily with the Cesium scene. In this example, which has a dedicated JavaScript file like the previous one, we will focus on Cesium and create some stars, a Sun, Moon, some water effects, and lighting effects. This example is called ch09_cesium_extend.
First, let's extend our control and modify the exposed Cesium scene. We will request some additional data from the terrain provider:
ol.control.Cesium = function (opt_options) {
    […]
        scene.terrainProvider = new Cesium.CesiumTerrainProvider({
            url: 'http://assets.agi.com/stk-terrain/world',
            requestWaterMask: true,
            requestVertexNormals: true
        });
The water mask is quite an expressive name; we use it to request the shorelines of the terrain. With this option set to true, Cesium will render a more water-like texture to water bodies and even animate waves on higher zoom levels. Vertex Normal is a bit of a different term. With this option, we can request information in order to shade the terrain. Next, we will create the sky along with the stars:
        scene.skyBox = new Cesium.SkyBox({
            sources: {
                positiveX: Cesium.buildModuleUrl('Assets/Textures/SkyBox/tycho2t3_80_px.jpg'),
                negativeX: Cesium.buildModuleUrl('Assets/Textures/SkyBox/tycho2t3_80_mx.jpg'),
                positiveY: Cesium.buildModuleUrl('Assets/Textures/SkyBox/tycho2t3_80_py.jpg'),
                negativeY: Cesium.buildModuleUrl('Assets/Textures/SkyBox/tycho2t3_80_my.jpg'),
                positiveZ: Cesium.buildModuleUrl('Assets/Textures/SkyBox/tycho2t3_80_pz.jpg'),
                negativeZ: Cesium.buildModuleUrl('Assets/Textures/SkyBox/tycho2t3_80_mz.jpg')
            }
        });
Cesium ships with some default textures, such as one for water bodies, another for the Moon, and multiple JPEG images for a darkly colored sky. We have to supply these images manually since there are no default values for the SkyBox sources. There is a convenient method, however, that lets us use the path from the Cesium directory, called buildModuleUrl. Finally, we add the Moon and Sun as well as enable lighting effects on the Earth. To achieve this, we have to use the scene's globe property, which represents the Earth. For the Moon, we disable the lighting effect; otherwise, we would only see a black disk in its place:
        scene.moon = new Cesium.Moon({
            onlySunLighting: false
        });
        scene.sun = new Cesium.Sun();
        scene.globe.enableLighting = true;
        […]
If you load this example, you can admire the multiple textures and effects provided by Cesium directly in your browser: