Table of Contents for
Mastering OpenLayers 3
 Mastering OpenLayers 3
Published by
Packt Publishing, 2016
Mastering OpenLayers 3
Published by
Packt Publishing, 2016
- Cover
- Table of Contents
- Mastering OpenLayers 3
- Mastering OpenLayers 3
- Credits
- About the Author
- About the Reviewer
- www.PacktPub.com
- Preface
- What you need for this book
- Who this book is for
- Conventions
- Reader feedback
- Customer support
- 1. Creating Simple Maps with OpenLayers 3
- Structure of OpenLayers 3
- Building the layout
- Using the API documentation
- Debugging the code
- Summary
- 2. Applying Custom Styles
- Customizing the default appearance
- Styling vector layers
- Customizing the appearance with JavaScript
- Creating a WebGIS client layout
- Summary
- 3. Working with Layers
- Building a layer tree
- Adding layers dynamically
- Adding vector layers with the File API
- Adding vector layers with a library
- Removing layers dynamically
- Changing layer attributes
- Changing the layer order with the Drag and Drop API
- Clearing the message bar
- Summary
- 4. Using Vector Data
- Accessing attributes
- Setting attributes
- Validating attributes
- Creating thematic layers
- Saving vector data
- Saving with WFS-T
- Modifying the geometry
- Summary
- 5. Creating Responsive Applications with Interactions and Controls
- Building the toolbar
- Mapping interactions to controls
- Building a set of feature selection controls
- Adding new vector layers
- Building a set of drawing tools
- Modifying and snapping to features
- Creating new interactions
- Building a measuring control
- Summary
- 6. Controlling the Map – View and Projection
- Customizing a view
- Constraining a view
- Creating a navigation history
- Working with extents
- Rotating a view
- Changing the map's projection
- Creating custom animations
- Summary
- 7. Mastering Renderers
- Using different renderers
- Creating a WebGL map
- Drawing lines and polygons with WebGL
- Blending layers
- Clipping layers
- Exporting a map
- Creating a raster calculator
- Creating a convolution matrix
- Clipping a layer with WebGL
- Summary
- 8. OpenLayers 3 for Mobile
- Responsive styling with CSS
- Generating geocaches
- Adding device-dependent controls
- Vectorizing the mobile version
- Making the mobile application interactive
- Summary
- 9. Tools of the Trade – Integrating Third-Party Applications
- Exporting a QGIS project
- Importing shapefiles
- Spatial analysis with Turf
- Spatial analysis with JSTS
- 3D rendering with Cesium
- Summary
- 10. Compiling Custom Builds with Closure
- Configuring Node JS
- Compiling OpenLayers 3
- Bundling an application with OpenLayers 3
- Extending OpenLayers 3
- Creating rich documentation with JSDoc
- Summary
- Index
Now that we are quite familiar with the possibilities of styling our maps with CSS and the inner methods, the next step is to create the layout of a WebGIS application. This step requires us to rethink our design patterns. The goal of this chapter is to create an application-specific design that doesn't prevent future developers from using the default options. This way, we can create a general wrapper API, which extends the capabilities of the library in a developer-friendly way.
First, let's extend the HTML part of our application. For a proper WebGIS client, the map canvas is only a part of the complete application. As mentioned in the beginning, for now, we only build the tool bar and the notification bar. We extend the HTML like in the example named ch02_webgis.html:
<!DOCTYPE html>
<html lang="en">
    <head>
        <meta charset="utf-8">
        <title>Chapter 2 - Preparing a WebGIS Application</title>
        <link href="../../js/ol3-3.9.0/ol.css" rel="stylesheet">
        <link href="ch02_webgis.css" rel="stylesheet">
        <script type="text/javascript" src="../../js/ol3-3.9.0/ol.js"></script>
        <script type="text/javascript" src="ch02_webgis.js"></script>
    </head>
    <body>
        <div class="map-container">
            <div id="toolbar" class="toolbar"></div>
            <div id="map" class="map">
                <div class="nosupport">Your browser doesn't seem to support this application. Please, update it.</div>
            </div>
            <div class="notification-bar">
                <div id="messageBar" class="message-bar"></div>
                <div id="coordinates"></div>
            </div>
        </div>
    </body>
</html>
Now we put everything in a map container. The sizes of the element are relative to the container. We also put a built-in error message in the HTML, which will be covered up by the map if the browser can load it.
As you have noticed, we created our HTML by defining simple elements with class names. We style these elements in a separate CSS file with class-based rules. Firstly, we style the map container element with the error message:
body {
    margin: 0px;
}
.map-container {
    width: 100%;
    height: 100%; /*Fallback*/
    height: 100vh;
}
.map {
    width: 100%;
    height: calc(100% - 3.5em);
}
.nosupport {
    position: absolute;
    width: 100%;
    top: 50%;
    transform: translateY(-50%);
    text-align: center;
}
Note
In Web design, horizontal alignment goes smoothly, but vertical alignment can be painful. In the nosupport class, you can see the most typical hack. The absolute positioning allows you to manually align the element with the parent. Setting the top attribute to 50% pushes down the element's top-side to the middle of the parent element. Giving it a -50% vertical transformation with translateY pulls back the element by 50% of its height.
Next, we style the notification bar. It has two parts, one for the mouse position control and one for the messages that the application will communicate. Now, we only style the coordinate indicator:
.notification-bar {
    width: 100%;
    height: 1.5em;
    display: table;
}
.notification-bar > div {
    height: 100%;
    display: table-cell;
    border: 1px solid grey;
    width: 34%;
    box-sizing: border-box;
    vertical-align: middle;
}
.notification-bar .message-bar {
    width: 66%;
}
.notification-bar .ol-mouse-position {
    font-family: monospace;
    text-align: center;
    position: static;
}
Regardless of using the div elements, we style the notification bar to render table-like. This way, we can vertically align the text messages that the application will output in an easy manner. It needs a parent element with the table display and child elements with the table-cell display (at least in Internet Explorer).
Note
In an HTML document, every visible element is rendered as a box. Every box has four edges: content, padding, border, and margin. By default, browsers use a content-box model, which applies the computed size only to the content. As we use a 100% width for the element, but we apply a 1 pixel border, the resulting box will exceed the maximum width of the screen by 4 pixels. This is why we use a border-box model, which includes the padding, and the border to the computed size of the box.
Finally, we style the tool bar for the controls. For now, it can only handle one line of buttons, but it can be expanded if more controls are needed:
.toolbar {
    height: 2em;
    display: table;
    padding-left: .2em;
}
.toolbar .ol-control {
    position: static;
    display: table-cell;
    vertical-align: middle;
    padding: 0;
}
.toolbar .ol-control button {
    border-radius: 2px;
    background-color: rgba(219,63,63,.5);
    width: 2em;
    display: inline-block;
}
.toolbar .ol-control button:hover {
    background-color: rgba(219,63,63,1);
}
As before, the styling of the control buttons are basically the same. The only difference is that we give them an inline-block display if they are in the tool bar. This way, the zoom controls, which are vertically stacked by default, become horizontally aligned. We vertically center the elements of the tool bar with the table method described above.
With the CSS rules and the HTML elements in place, the final task is to write the code part of the example. The code will be based on the previous example; however, we will strip it down to only contain the most necessary parts:
var map = new ol.Map({
target: 'map',
layers: [
new ol.layer.Tile({
source: new ol.source.OSM()
}),
new ol.layer.Vector({
source: new ol.source.Vector({
format: new ol.format.GeoJSON({
defaultDataProjection: 'EPSG:4326'
}),
url: '../../res/world_capitals.geojson',
attributions: [
new ol.Attribution({
html: 'World Capitals © Natural Earth'
})
]
})
})
],
controls: [
new ol.control.Zoom({
target: 'toolbar'
}),
new ol.control.MousePosition({
coordinateFormat: function(coordinates) {
var coord_x = coordinates[0].toFixed(3);
var coord_y = coordinates[1].toFixed(3);
return coord_x + ', ' + coord_y;
},
target: 'coordinates'
})
],
view: new ol.View({
center: [0, 0],
zoom: 2
})
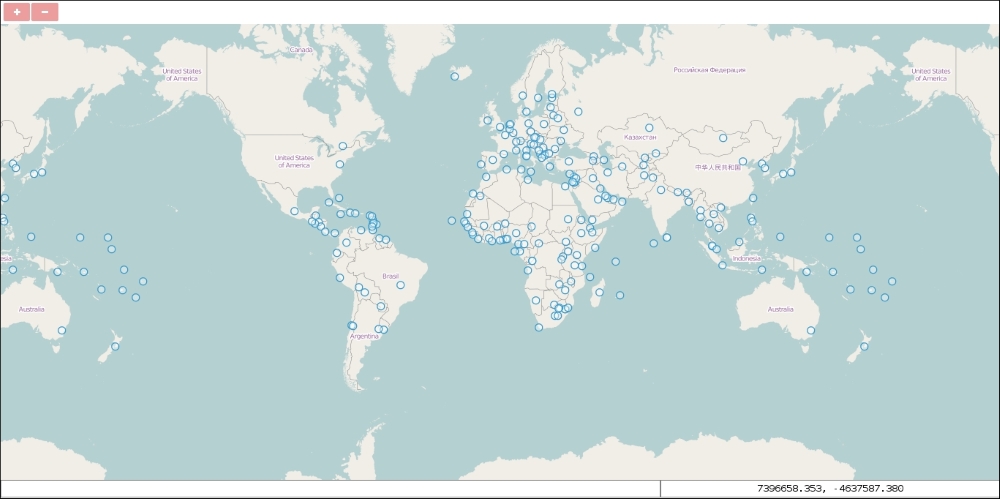
});We cut out the entire interactions part. This way, we don't have to save the vector layer into a separate variable. We keep the base layer and the vector layer to have something for our map to display. We cut out most of the controls and only define the zoom buttons and the mouse position controls. As we do not extend the default set of controls, but instead define some, the default ones won't be present in our map, unless we add them manually.
The main extension to the previous examples is the placement of the controls. We can specify where OpenLayers 3 should place a control with the target parameter. We can provide a DOM element, or just simply the id of our element of choice. We place our controls according to our design in the tool bar and the coordinate container. If you save the complete example and open it up, you will see our application: