Table of Contents for
Mastering OpenLayers 3
 Mastering OpenLayers 3
Published by
Packt Publishing, 2016
Mastering OpenLayers 3
Published by
Packt Publishing, 2016
- Cover
- Table of Contents
- Mastering OpenLayers 3
- Mastering OpenLayers 3
- Credits
- About the Author
- About the Reviewer
- www.PacktPub.com
- Preface
- What you need for this book
- Who this book is for
- Conventions
- Reader feedback
- Customer support
- 1. Creating Simple Maps with OpenLayers 3
- Structure of OpenLayers 3
- Building the layout
- Using the API documentation
- Debugging the code
- Summary
- 2. Applying Custom Styles
- Customizing the default appearance
- Styling vector layers
- Customizing the appearance with JavaScript
- Creating a WebGIS client layout
- Summary
- 3. Working with Layers
- Building a layer tree
- Adding layers dynamically
- Adding vector layers with the File API
- Adding vector layers with a library
- Removing layers dynamically
- Changing layer attributes
- Changing the layer order with the Drag and Drop API
- Clearing the message bar
- Summary
- 4. Using Vector Data
- Accessing attributes
- Setting attributes
- Validating attributes
- Creating thematic layers
- Saving vector data
- Saving with WFS-T
- Modifying the geometry
- Summary
- 5. Creating Responsive Applications with Interactions and Controls
- Building the toolbar
- Mapping interactions to controls
- Building a set of feature selection controls
- Adding new vector layers
- Building a set of drawing tools
- Modifying and snapping to features
- Creating new interactions
- Building a measuring control
- Summary
- 6. Controlling the Map – View and Projection
- Customizing a view
- Constraining a view
- Creating a navigation history
- Working with extents
- Rotating a view
- Changing the map's projection
- Creating custom animations
- Summary
- 7. Mastering Renderers
- Using different renderers
- Creating a WebGL map
- Drawing lines and polygons with WebGL
- Blending layers
- Clipping layers
- Exporting a map
- Creating a raster calculator
- Creating a convolution matrix
- Clipping a layer with WebGL
- Summary
- 8. OpenLayers 3 for Mobile
- Responsive styling with CSS
- Generating geocaches
- Adding device-dependent controls
- Vectorizing the mobile version
- Making the mobile application interactive
- Summary
- 9. Tools of the Trade – Integrating Third-Party Applications
- Exporting a QGIS project
- Importing shapefiles
- Spatial analysis with Turf
- Spatial analysis with JSTS
- 3D rendering with Cesium
- Summary
- 10. Compiling Custom Builds with Closure
- Configuring Node JS
- Compiling OpenLayers 3
- Bundling an application with OpenLayers 3
- Extending OpenLayers 3
- Creating rich documentation with JSDoc
- Summary
- Index
Apart from direct styling with CSS, OpenLayers 3 offers some methods to specify the appearance of our maps. These methods can be used to make such changes in the behavior of the controls, which would otherwise be quite hard to achieve, if not impossible. In the next example, we will look at some of the JavaScript-based customizing options.
If you open up the code attachment, you can see some files named ch02_controls. In these files, you can examine the changes we made to the previous example. The main changes, like the title suggests, will be in the JavaScript part of the example.
In this example, we will group the controls based on their position on the map. In the bottom-left corner, we already lifted the overview map above the scale bar. Now, it is time to change some of their inner properties:
var map = new ol.Map({
    […]
    controls: [
        […]
        new ol.control.ScaleLine({
            units: 'degrees'
        }),
        new ol.control.OverviewMap({
            collapsible: false
        })
        […]
});
The scale bar now shows the scale in degrees, regardless of the map projection. We will later see that, in a WebGIS application, the unit of this control will be bounded to the unit of the current projection. However, the valid options for the controls are only degrees, imperial, nautical, metric, and us.
The overview map is now opened and cannot be closed. However, if you save these changes and open it up in a browser, you can see that the opened overview map covers up the scale bar again. To resolve this issue, we have to extend our CSS file with an additional rule:
.ol-overviewmap.ol-uncollapsible {
    bottom: 2em;
}
If we set an otherwise collapsible control to not collapsible, the library gives a specific class name to the control's DOM element called ol-uncollapsible. Remember the rules of CSS specificity: the more specific declaration wins. This way, we have to make our rule at least as specific as the original one, which uses a logical AND operator between the two classes. We also use this method, which can be achieved in CSS by concatenating the two class names.
The MousePosition control outputs the current mouse coordinates with great precision. This can be good; however, we will fix it to exactly three digits in the next step. Luckily, the control offers a property for a preprocessing function. Let's create a function that can truncate the output to three-digit precision:
new ol.control.MousePosition({
    coordinateFormat: function (coordinates) {
        var coord_x = coordinates[0].toFixed(3);
        var coord_y = coordinates[1].toFixed(3);
        return coord_x + ', ' + coord_y;
    }
})
The function receives an array with two coordinates as an input, and requires a string as an output. We separate the array members into variables and fix them to three decimal places with JavaScript's toFixed function. Next, we return the fixed numbers converted to a string.
Note
When a number is added to a string with the JavaScript's arithmetic + operator, it makes an automatic type conversion and concatenates the number(s) to the string(s). In our case, add the coordinate values to a string containing a comma, and a whitespace is enough to return an automatically converted string.
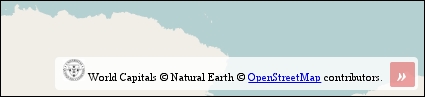
The goal of this step is to rework the attribution element's appearance and content a little bit. We will change the font type of the attribution control and the logo of the map. The logo is a rarely mentioned element of the map, but it plays an important role in every organization. This logo represents the given organization, and in most cases, it gets on the map in one way or another. OpenLayers 3, however, offers a method to define our custom logo and displays it in the attribution control.
Firstly, let's declare some rules for a new CSS class. It contains the required information to style the font of the attribution control:
.info-label {
    font-family: Palatino, serif;
    font-style: italic;
}
.ol-attribution img {
    max-width: 2em;
}Next, we create a span element in our JavaScript code to apply our newly created custom style on it:
var infoLabel = document.createElement('span');
infoLabel.className = 'info-label';
infoLabel.textContent = 'i';
Tip
If you would like to add some text to the element, always use textContent instead of innerHTML. As innerHTML tries to parse its content as HTML, textContent is much faster. There are also some security vulnerabilities behind innerHTML, but they are related to the user input and are out of the scope of this book.
Now, we just have to include our custom element in the attribution control's constructor:
new ol.control.Attribution({
    label: infoLabel
})
For the custom logo, we have to supply an object containing its attributes to the map object. Then, the logo will appear in the attribution control. The object has a mandatory url and an optional href parameter:
var map = new ol.Map({
    […]
    logo: {
        src: '../../res/university_of_pecs.png',
        href: 'http://www.ttk.pte.hu/en'
    }
});If you put every part of the code in place, save them and load the result in a browser; you will see the following customized map:
You can also customize the appearance of the attribution control with some simple CSS rules:
.ol-attribution span {
    font-family: Palatino, serif;
    font-style: italic;
}
However, these rules also apply to the » symbol shown when the control is not collapsed: