Table of Contents for
Mastering OpenLayers 3
 Mastering OpenLayers 3
Published by
Packt Publishing, 2016
Mastering OpenLayers 3
Published by
Packt Publishing, 2016
- Cover
- Table of Contents
- Mastering OpenLayers 3
- Mastering OpenLayers 3
- Credits
- About the Author
- About the Reviewer
- www.PacktPub.com
- Preface
- What you need for this book
- Who this book is for
- Conventions
- Reader feedback
- Customer support
- 1. Creating Simple Maps with OpenLayers 3
- Structure of OpenLayers 3
- Building the layout
- Using the API documentation
- Debugging the code
- Summary
- 2. Applying Custom Styles
- Customizing the default appearance
- Styling vector layers
- Customizing the appearance with JavaScript
- Creating a WebGIS client layout
- Summary
- 3. Working with Layers
- Building a layer tree
- Adding layers dynamically
- Adding vector layers with the File API
- Adding vector layers with a library
- Removing layers dynamically
- Changing layer attributes
- Changing the layer order with the Drag and Drop API
- Clearing the message bar
- Summary
- 4. Using Vector Data
- Accessing attributes
- Setting attributes
- Validating attributes
- Creating thematic layers
- Saving vector data
- Saving with WFS-T
- Modifying the geometry
- Summary
- 5. Creating Responsive Applications with Interactions and Controls
- Building the toolbar
- Mapping interactions to controls
- Building a set of feature selection controls
- Adding new vector layers
- Building a set of drawing tools
- Modifying and snapping to features
- Creating new interactions
- Building a measuring control
- Summary
- 6. Controlling the Map – View and Projection
- Customizing a view
- Constraining a view
- Creating a navigation history
- Working with extents
- Rotating a view
- Changing the map's projection
- Creating custom animations
- Summary
- 7. Mastering Renderers
- Using different renderers
- Creating a WebGL map
- Drawing lines and polygons with WebGL
- Blending layers
- Clipping layers
- Exporting a map
- Creating a raster calculator
- Creating a convolution matrix
- Clipping a layer with WebGL
- Summary
- 8. OpenLayers 3 for Mobile
- Responsive styling with CSS
- Generating geocaches
- Adding device-dependent controls
- Vectorizing the mobile version
- Making the mobile application interactive
- Summary
- 9. Tools of the Trade – Integrating Third-Party Applications
- Exporting a QGIS project
- Importing shapefiles
- Spatial analysis with Turf
- Spatial analysis with JSTS
- 3D rendering with Cesium
- Summary
- 10. Compiling Custom Builds with Closure
- Configuring Node JS
- Compiling OpenLayers 3
- Bundling an application with OpenLayers 3
- Extending OpenLayers 3
- Creating rich documentation with JSDoc
- Summary
- Index
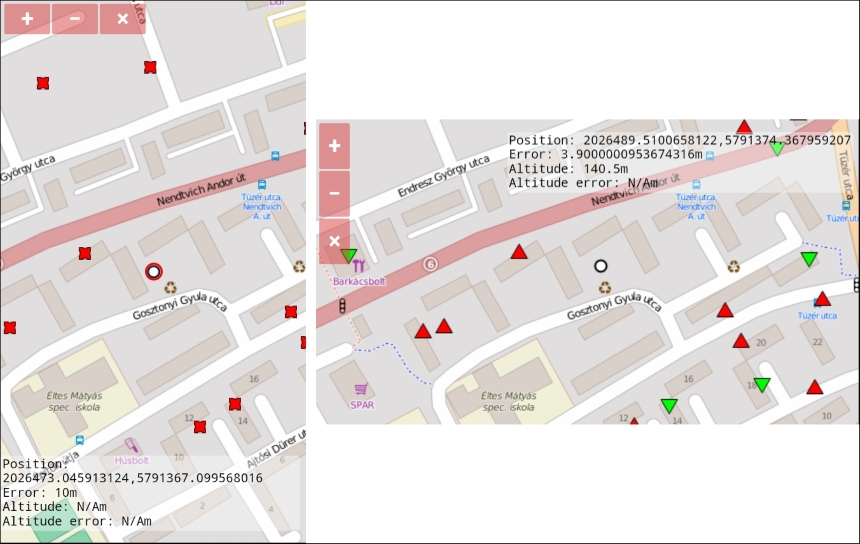
In the next example, called ch08_styling, we improve our touch device version with another vector layer and some styling. We display the current position of the user and the accuracy of the position in meters, and style the geocaches based on the height difference of our position and the caches. Firstly, we create a layer containing our position and give it a static style:
if (ol.has.TOUCH) {
    […]
    var positionLyr = new ol.layer.Vector({
        source: new ol.source.Vector(),
        style: new ol.style.Style({
            image: new ol.style.Circle({
                fill: new ol.style.Fill({
                    color: [255, 255, 255, 1]
                }),
                stroke: new ol.style.Stroke({
                    color: [0, 0, 0, 1],
                    width: 2
                }),
                radius: 6
            }),
            stroke: new ol.style.Stroke({
                color: [255, 0, 0, 1],
                width: 2
            })
        })
    });
    map.addLayer(positionLyr);
We will have two kinds of features in this layer. If we have to deal with a point feature, it will be our position that we style with the image property. Every other layer, regardless of its type, will be displayed with a red line or an outline. Next, we update our layer every time we receive a new position:
    geoloc.on('change', function (evt) {
        […]
        var positionSrc = positionLyr.getSource();
        positionSrc.clear(true);
        positionSrc.addFeatures([
            new ol.Feature({
                geometry: new ol.geom.Point(evt.target.getPosition())
            }),
            new ol.Feature({
                geometry: new ol.geom.Circle(evt.target.getPosition(), evt.target.getAccuracy())
            })
        ]);
        geoCaching.setStyle(geoCaching.getStyleFunction());
    });
The first part is simple: we fast-clear our new layer's source by providing a true value to its clear method. This way, no removefeature events get dispatched, increasing the performance of our application. After this, we add two new features, one for our position and one to display the accuracy of it. Next, we update the style of our geocaches, as styles returned by style functions become static after evaluation.
Finally, we provide the style function that will be updated regularly. In this function, we evaluate some common values based on the feature's and the position's altitude. If a cache is almost on the same elevation as us, we symbolize it as a yellow square. If it lies higher, it will be a red triangle pointing upwards. If it is lower than us, it's shape will be a green triangle pointing downwards:
    geoCaching.setStyle(function (feature, res) {
        if (geoloc.getAltitude()) {
            var altitude = geoloc.getAltitude();
            var zCoord = feature.getGeometry().getCoordinates()[2];
            var shapePts, shapeColor, shapeAngle;
            if (Math.abs(altitude - zCoord) < 1) {
                shapePts = 4;
                shapeColor = [255, 255, 0, 1];
                shapeAngle = Math.PI / 4;
            } else if (zCoord < altitude) {
                shapePts = 3;
                shapeColor = [0, 255, 0, 1];
                shapeAngle = Math.PI;
            } else {
                shapePts = 3;
                shapeColor = [255, 0, 0, 1];
                shapeAngle = 0;
            }
Now we can return the appropriate style object for our cache. If we can get an altitude from our Geolocation object, we return a style evaluated previously; otherwise, if the GPS signal is not adequate to give an altitude value, we display our caches with red X symbols. We can create such a shape by creating a star with four tips and a great difference between its inner and outer radii:
            return [new ol.style.Style({
                image: new ol.style.RegularShape({
                    fill: new ol.style.Fill({
                        color: shapeColor
                    }),
                    stroke: new ol.style.Stroke({
                        color: [0, 0, 0, 1],
                        width: 1
                    }),
points: shapePts,
radius: 10,
angle: shapeAngle
})
})];
} else {
return [new ol.style.Style({
image: new ol.style.RegularShape({
fill: new ol.style.Fill({
color: [255, 0, 0, 1]
}),
stroke: new ol.style.Stroke({
color: [0, 0, 0, 1],
width: 1
}),
points: 4,
radius1: 5,
radius2: 10,
angle: Math.PI / 2
})
})];
}
});
}If you save the code and look it up from your smartphone, you will see the dynamic rendering of our position and symbols: