Table of Contents for
Mastering OpenLayers 3
 Mastering OpenLayers 3
Published by
Packt Publishing, 2016
Mastering OpenLayers 3
Published by
Packt Publishing, 2016
- Cover
- Table of Contents
- Mastering OpenLayers 3
- Mastering OpenLayers 3
- Credits
- About the Author
- About the Reviewer
- www.PacktPub.com
- Preface
- What you need for this book
- Who this book is for
- Conventions
- Reader feedback
- Customer support
- 1. Creating Simple Maps with OpenLayers 3
- Structure of OpenLayers 3
- Building the layout
- Using the API documentation
- Debugging the code
- Summary
- 2. Applying Custom Styles
- Customizing the default appearance
- Styling vector layers
- Customizing the appearance with JavaScript
- Creating a WebGIS client layout
- Summary
- 3. Working with Layers
- Building a layer tree
- Adding layers dynamically
- Adding vector layers with the File API
- Adding vector layers with a library
- Removing layers dynamically
- Changing layer attributes
- Changing the layer order with the Drag and Drop API
- Clearing the message bar
- Summary
- 4. Using Vector Data
- Accessing attributes
- Setting attributes
- Validating attributes
- Creating thematic layers
- Saving vector data
- Saving with WFS-T
- Modifying the geometry
- Summary
- 5. Creating Responsive Applications with Interactions and Controls
- Building the toolbar
- Mapping interactions to controls
- Building a set of feature selection controls
- Adding new vector layers
- Building a set of drawing tools
- Modifying and snapping to features
- Creating new interactions
- Building a measuring control
- Summary
- 6. Controlling the Map – View and Projection
- Customizing a view
- Constraining a view
- Creating a navigation history
- Working with extents
- Rotating a view
- Changing the map's projection
- Creating custom animations
- Summary
- 7. Mastering Renderers
- Using different renderers
- Creating a WebGL map
- Drawing lines and polygons with WebGL
- Blending layers
- Clipping layers
- Exporting a map
- Creating a raster calculator
- Creating a convolution matrix
- Clipping a layer with WebGL
- Summary
- 8. OpenLayers 3 for Mobile
- Responsive styling with CSS
- Generating geocaches
- Adding device-dependent controls
- Vectorizing the mobile version
- Making the mobile application interactive
- Summary
- 9. Tools of the Trade – Integrating Third-Party Applications
- Exporting a QGIS project
- Importing shapefiles
- Spatial analysis with Turf
- Spatial analysis with JSTS
- 3D rendering with Cesium
- Summary
- 10. Compiling Custom Builds with Closure
- Configuring Node JS
- Compiling OpenLayers 3
- Bundling an application with OpenLayers 3
- Extending OpenLayers 3
- Creating rich documentation with JSDoc
- Summary
- Index
When we create custom web maps, we cannot always rely on already developed OWS services. Sometimes, we need to publish our own data regardless of whether it is plotted directly from some measurements or processed from existent data. If we have to process our data before publishing it, we usually do it in a desktop GIS environment. However, one of these environments, called QGIS, is not only capable of advanced geoprocessing, but with a little help, we can export our results directly in the form of a web map using OpenLayers 3.
If you are a GIS person, you might be familiar with QGIS. If this is the case, just install the qgis2web plugin, load the project provided with the code (ch09_qgis.qgs), and skip to the part where we use the plugin to export the layers. If you are not familiar with QGIS, don't worry. Keep reading, and you will be up and running in no time.
Quantum GIS is an open source desktop GIS application. It started slowly, but with enough time and effort from its community, it became the most competent open source GIS application of its time. From version 2.0, it gained very powerful geoprocessing capabilities as developers integrated some other open source GIS applications with it. Now, it harnesses the power of the most capable open source applications and libraries such as GDAL, GRASS, or SAGA, and offers a user-friendly GUI and Python API for enhanced user experience. With these considerations in mind, QGIS is now accepted as valid competition even for the best commercial desktop GIS, ArcGIS.
QGIS is a modular software. It is written in C++ but also has a Python API; thus, people can extend it and write modules in it in any of these languages. Using the Python API, people can create dynamic modules, called plugins, which can be used by anyone via an inner plugin management system. These specialized Python modules, which are created by company employees and enthusiastic individuals, make QGIS an even richer GIS environment.
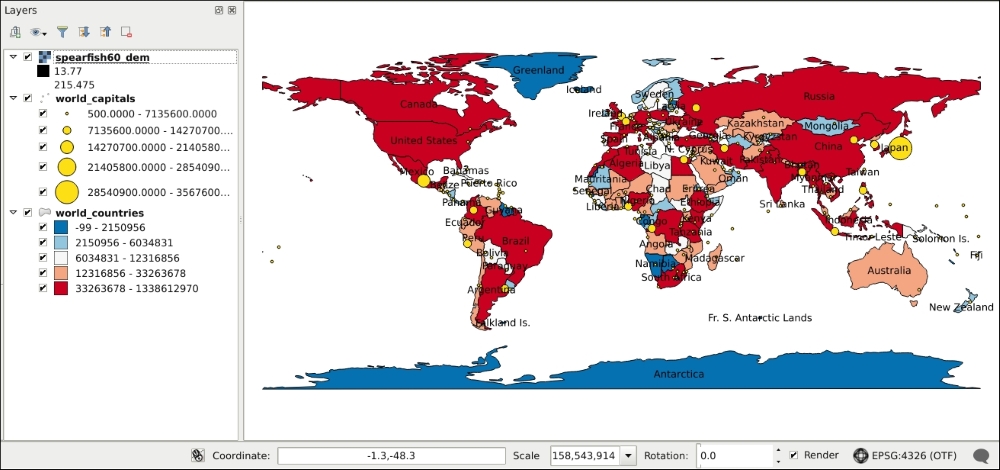
First, start QGIS. You will see the layer tree on the left-hand side, the map canvas on the right-hand side, and some control buttons at the top and far-left. There is also a notification bar at the bottom with some extra controls. Does this resemble something similar to what you've seen before? We designed our WebGIS application in the last few chapters based on the layout of QGIS, which basically matches the layout of the most popular desktop GIS applications. At the top of the window, you can see a menu bar. From there, access the plugin manager. It's in the Plugins menu, called Manage and Install Plugins.... After opening the manager, wait for QGIS to fetch the available plugins from the default repository.
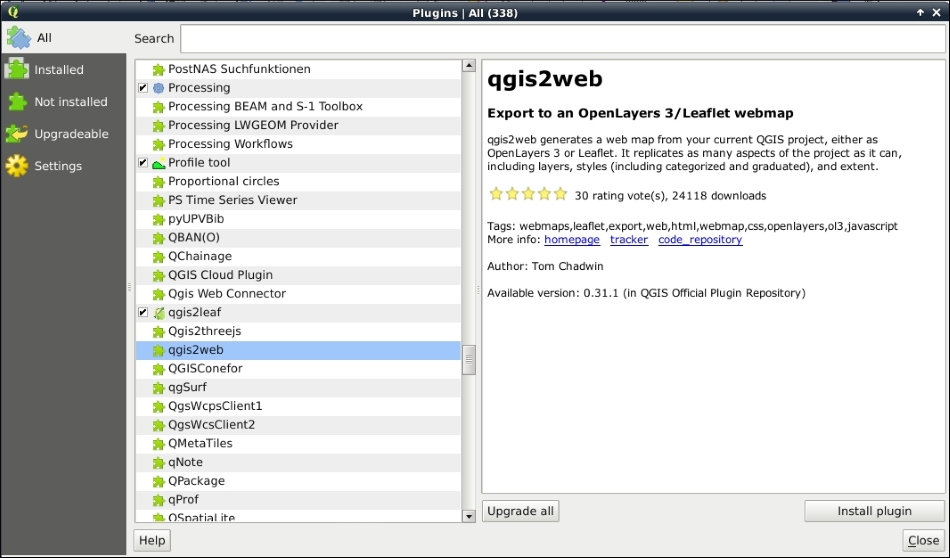
Next, scroll down to the plugin named qgis2web. This plugin wraps itself around other plugins that are capable of exporting QGIS projects to web maps using OpenLayers 3 (qgis-ol3) and Leaflet (qgis2leaf). However, the OpenLayers 3 exporter is not available in its original form, and nevertheless, this plugin ships with a great preview window to check the results before exporting the map. Click on Install plugin to download it, and you will see a new button in your toolbar as a result:
Now that you have the plugin installed, open the QGIS project provided with the code, called ch09_qgis.qgs, and inspect its contents. You can open a project by clicking on the yellow folder icon in the toolbar, the Open... button in the Project menu, or just by pressing Ctrl + O. You can also drag and drop the project file into the application window. As you can see, there are two vector layers and one raster layer included in various projections. With an elevation map, a choropleth country map, graduated capitals map, and some labels from the countries map, we can test the plugin against the most basic display types.
With the toolbar on the left-hand side of the window, you can add additional layers, while in the layers' Properties window, you can adjust the styling. You can access this window by right-clicking on a layer element in the layer tree and selecting the corresponding menu entry:
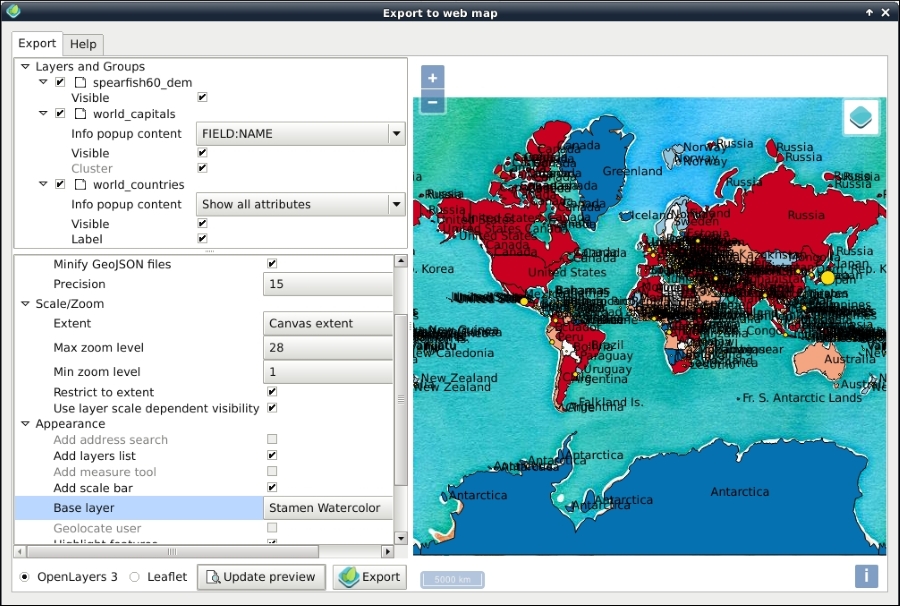
Next, we open the qgis2web plugin to customize our map before exporting it. You can access the plugin from the toolbar or the Web menu's qgis2web entry. In the plugin's main window, you will see our layers nicely aligned in the preview window. However, there is something weird about them. The plugin can export maps in Web Mercator or the project's projection. When it exports the project, it transforms and warps every layer to the chosen projection before showing them.
Note
Did you notice that Antarctica in the countries' layer only extends to 85 degrees south instead of 90 degrees? Web Mercator's validity extent only extends to 85.06 degrees north and south. Beyond these limits, transformations produce great errors, ending in 90 degrees, which is equal to infinity in Web Mercator. This phenomenon also has an effect on the plugin. If we provide a layer with an extent outside Web Mercator's validity extent, we won't see anything in the preview window.
Let's make a thorough test and check checkboxes everything aside from the Show popups on hover and Match project CRS options. This way, we have to click on the map to identify its features. However, to have popups, we need some attributes to expose. In the top window, we add some attributes to the popups (Info popup content). Finally, we define a base layer in the bottom window, and then we export the composition:
Note
In the latest version of qgis2web (0.39.0), the plugin lacks the capability of exporting or displaying raster layers in the preview window. If you see an error message in the preview window, simply disable the raster layer in the top window, and click on Update preview. Naturally, by doing this, the raster layer won't be exported.
Once you click on Export, the plugin will open the exported map in your default browser. The first thing we can see in the preview already is that this composition is ugly and cannot be used as a map. Nevertheless, the plugin works great and can render every display type we provided in our project. The result is good as a quick preview but nothing more. However, there is valuable information coded in the created files. Let's navigate to the export folder and examine those files.
First, there is the index.html file, which contains two libraries, some styling, and the JavaScript part of the aggregated map. One of the libraries is OpenLayers 3. As we requested a layer switcher in the plugin, it also linked an extension to the library called OpenLayers 3 LayerSwitcher. This is a lightweight layer switcher, capable of handling base layers and overlays. It allows us to select from multiple base layers and toggle the visibility of overlays.
Tip
You can download OpenLayers 3 LayerSwitcher from the GitHub repository at https://github.com/walkermatt/ol3-layerswitcher/releases.
If we further examine the index file, we can see that there are other local JavaScript files included from the layers and styles folder. Let's check these scripts for additional valuable information. In the layers folder, we can see that our elevation map is in a JPEG format, our vector layers in GeoJSON (saved to variables), and there is a layers.js file. Let's open the third file in a text editor:
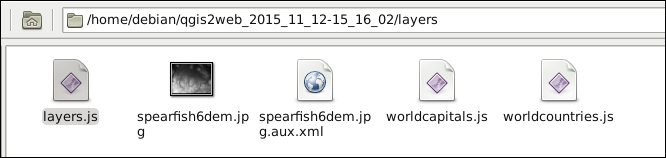
As we can see, the layer objects are created in this script. The most valuable information, which can be salvaged from this script, is our exported elevation layer's extent. It is in Web Mercator; however, we can transform it to any projection with OpenLayers 3:
var lyr_spearfish6dem = new ol.layer.Image({
                            opacity: 1,
                            title: "spearfish60_dem",
                            source: new ol.source.ImageStatic({
                               url: "./layers/spearfish6dem.jpg",
                                projection: 'EPSG:3857',
                                alwaysInRange: true,
                                imageSize: [634, 477],
                                imageExtent: [-11562879.041972, 5523336.351119, -11535975.014406, 5543008.947284]
                            })
                        });
As we now have the extent of the layer, we can export it in any browser-capable format from QGIS and have a better, but already georeferenced, image. For example, we could export it in PNG for a lossless result.
Tip
If you are familiar with our elevation map from the Spearfish60 example of GRASS, you must be wondering why it has floating point values and why those values range from 13.77 to 215.475. Well, QGIS, and, therefore, qgis2web, use GDAL to export images. The GDAL JPEG exporter only accepts rasters with values between 0 and 255. If you try to export an image with a wider value range, lower and higher values are set to 0 and 255, respectively.
Finally, let's navigate to the styles folder. In this folder, we can see a separate script for every vector layer that we have. If we open one of the scripts, we can also see the symbology for the graduated layers that are stored in these files. They are quite verbose and complicated; however, everything is in one place. We can get the intervals but also the associated colors or circle radii:
var ranges_worldcountries = [[-99.000000, 2150955.800000, [ new ol.style.Style({
                            stroke: new ol.style.Stroke({color: "rgba(0,0,0,1.0)", lineDash: null, width: 0}),
                        fill: new ol.style.Fill({color: "rgba(5,113,176,1.0)"})
                        })
                        ]],
[…]