Table of Contents for
Mastering OpenLayers 3
 Mastering OpenLayers 3
Published by
Packt Publishing, 2016
Mastering OpenLayers 3
Published by
Packt Publishing, 2016
- Cover
- Table of Contents
- Mastering OpenLayers 3
- Mastering OpenLayers 3
- Credits
- About the Author
- About the Reviewer
- www.PacktPub.com
- Preface
- What you need for this book
- Who this book is for
- Conventions
- Reader feedback
- Customer support
- 1. Creating Simple Maps with OpenLayers 3
- Structure of OpenLayers 3
- Building the layout
- Using the API documentation
- Debugging the code
- Summary
- 2. Applying Custom Styles
- Customizing the default appearance
- Styling vector layers
- Customizing the appearance with JavaScript
- Creating a WebGIS client layout
- Summary
- 3. Working with Layers
- Building a layer tree
- Adding layers dynamically
- Adding vector layers with the File API
- Adding vector layers with a library
- Removing layers dynamically
- Changing layer attributes
- Changing the layer order with the Drag and Drop API
- Clearing the message bar
- Summary
- 4. Using Vector Data
- Accessing attributes
- Setting attributes
- Validating attributes
- Creating thematic layers
- Saving vector data
- Saving with WFS-T
- Modifying the geometry
- Summary
- 5. Creating Responsive Applications with Interactions and Controls
- Building the toolbar
- Mapping interactions to controls
- Building a set of feature selection controls
- Adding new vector layers
- Building a set of drawing tools
- Modifying and snapping to features
- Creating new interactions
- Building a measuring control
- Summary
- 6. Controlling the Map – View and Projection
- Customizing a view
- Constraining a view
- Creating a navigation history
- Working with extents
- Rotating a view
- Changing the map's projection
- Creating custom animations
- Summary
- 7. Mastering Renderers
- Using different renderers
- Creating a WebGL map
- Drawing lines and polygons with WebGL
- Blending layers
- Clipping layers
- Exporting a map
- Creating a raster calculator
- Creating a convolution matrix
- Clipping a layer with WebGL
- Summary
- 8. OpenLayers 3 for Mobile
- Responsive styling with CSS
- Generating geocaches
- Adding device-dependent controls
- Vectorizing the mobile version
- Making the mobile application interactive
- Summary
- 9. Tools of the Trade – Integrating Third-Party Applications
- Exporting a QGIS project
- Importing shapefiles
- Spatial analysis with Turf
- Spatial analysis with JSTS
- 3D rendering with Cesium
- Summary
- 10. Compiling Custom Builds with Closure
- Configuring Node JS
- Compiling OpenLayers 3
- Bundling an application with OpenLayers 3
- Extending OpenLayers 3
- Creating rich documentation with JSDoc
- Summary
- Index
You might or you might not be familiar with vector styling at this point. If you know about the concept, however, a little revision won't hurt. In this example, we will change the default vector style of the example dataset to green stars. As vector data is drawn directly to the canvas by the library, their styles can be changed only by inner methods with a limited set of values.
You can see a js file named ch02_vector in the code appendix. You can use this file with the previous example or extend the original one with the following rules:
var vectorLayer = new ol.layer.Vector({
source: new ol.source.Vector({
format: new ol.format.GeoJSON({
defaultDataProjection: 'EPSG:4326'
}),
url: '../../res/world_capitals.geojson',
attributions: [
new ol.Attribution({
html: 'World Capitals © Natural Earth'
})
]
}),
style: new ol.style.Style({
image: new ol.style.RegularShape({
stroke: new ol.style.Stroke({
width: 2,
color: [6, 125, 34, 1]
}),
fill: new ol.style.Fill({
color: [25, 235, 75, 0.3]
}),
points: 5,
radius1: 5,
radius2: 8,
rotation: Math.PI
})
})
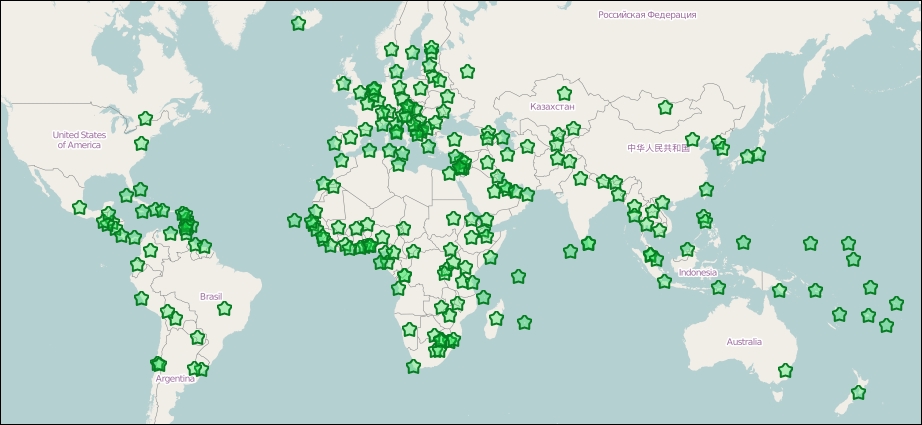
});In this simple style object, we define only a point symbolizer. It is a regular shape, which can be a simple, regular polygon. The polygon can be convex if it has only one radius value, and concave if it has two. Our star has five points and an outer radius of 8 pixels. The colors of its stroke, and fill, are expressed in RGBA values, which can be done by passing an array to their color parameter with four values. As the star will be upside down by default, we rotate it by 180 degrees The library only accepts radian values; thus, we have to rotate the star by π.
Save the updated code, link it to the previous example, and open it up in your favorite browser. You should see the capitals represented by green stars:
Tip
We have only defined a symbolizer for point geometries in our style object. This means that the line and polygon symbolizers are set to null. If you use this style object on line, or polygon features, they would simply not render. To make general style objects for multiple geometry types, you have to provide at least a stroke style and a fill style besides image.