Table of Contents for
Mastering OpenLayers 3
 Mastering OpenLayers 3
Published by
Packt Publishing, 2016
Mastering OpenLayers 3
Published by
Packt Publishing, 2016
- Cover
- Table of Contents
- Mastering OpenLayers 3
- Mastering OpenLayers 3
- Credits
- About the Author
- About the Reviewer
- www.PacktPub.com
- Preface
- What you need for this book
- Who this book is for
- Conventions
- Reader feedback
- Customer support
- 1. Creating Simple Maps with OpenLayers 3
- Structure of OpenLayers 3
- Building the layout
- Using the API documentation
- Debugging the code
- Summary
- 2. Applying Custom Styles
- Customizing the default appearance
- Styling vector layers
- Customizing the appearance with JavaScript
- Creating a WebGIS client layout
- Summary
- 3. Working with Layers
- Building a layer tree
- Adding layers dynamically
- Adding vector layers with the File API
- Adding vector layers with a library
- Removing layers dynamically
- Changing layer attributes
- Changing the layer order with the Drag and Drop API
- Clearing the message bar
- Summary
- 4. Using Vector Data
- Accessing attributes
- Setting attributes
- Validating attributes
- Creating thematic layers
- Saving vector data
- Saving with WFS-T
- Modifying the geometry
- Summary
- 5. Creating Responsive Applications with Interactions and Controls
- Building the toolbar
- Mapping interactions to controls
- Building a set of feature selection controls
- Adding new vector layers
- Building a set of drawing tools
- Modifying and snapping to features
- Creating new interactions
- Building a measuring control
- Summary
- 6. Controlling the Map – View and Projection
- Customizing a view
- Constraining a view
- Creating a navigation history
- Working with extents
- Rotating a view
- Changing the map's projection
- Creating custom animations
- Summary
- 7. Mastering Renderers
- Using different renderers
- Creating a WebGL map
- Drawing lines and polygons with WebGL
- Blending layers
- Clipping layers
- Exporting a map
- Creating a raster calculator
- Creating a convolution matrix
- Clipping a layer with WebGL
- Summary
- 8. OpenLayers 3 for Mobile
- Responsive styling with CSS
- Generating geocaches
- Adding device-dependent controls
- Vectorizing the mobile version
- Making the mobile application interactive
- Summary
- 9. Tools of the Trade – Integrating Third-Party Applications
- Exporting a QGIS project
- Importing shapefiles
- Spatial analysis with Turf
- Spatial analysis with JSTS
- 3D rendering with Cesium
- Summary
- 10. Compiling Custom Builds with Closure
- Configuring Node JS
- Compiling OpenLayers 3
- Bundling an application with OpenLayers 3
- Extending OpenLayers 3
- Creating rich documentation with JSDoc
- Summary
- Index
In this example, called ch04_thematic, we will create an automatic solution for thematic mapping. It will include graduated and categorized symbology. To keep the example as simple as possible, we will make some generally incorrect assumptions. Firstly, we assume that we only have to style polygon layers. For graduated symbology, we hard code the intervals to five and also the color ramp starting from a beige tone and ending in a burgundy color. We will implement the whole code into our layer tree.
We create the required GUI options in the layer tree. Firstly, we check against the origin of the layer. If it is a vector layer, we create an empty list and three buttons for the different styling options. Then, we save the default style in the layer, as it will enable us to restore the original styling. Finally, we register an event listener to the layer object. If the headers are changed, we rebuild the attribute list in the layer tree:
this.createRegistry = function (layer, buffer) {
    […]
    if (layer instanceof ol.layer.Vector) {
        layerControls.appendChild(document.createElement('br'));
        var attributeOptions = document.createElement('select');
        layerControls.appendChild(this.stopPropagationOnEvent(attributeOptions, 'click'));
        layerControls.appendChild(document.createElement('br'));
        var defaultStyle = this.createButton('stylelayer', 'Default', 'stylelayer', layer);
        layerControls.appendChild(this.stopPropagationOnEvent(defaultStyle, 'click'));
        var graduatedStyle = this.createButton('stylelayer', 'Graduated', 'stylelayer', layer);
        layerControls.appendChild(this.stopPropagationOnEvent(graduatedStyle, 'click'));
        var categorizedStyle = this.createButton('stylelayer', 'Categorized', 'stylelayer', layer);
        layerControls.appendChild(this.stopPropagationOnEvent(categorizedStyle, 'click'));
        layer.set('style', layer.getStyle());
        layer.on('propertychange', function (evt) {
            if (evt.key === 'headers') {
                this.removeContent(attributeOptions);
                var headers = layer.get('headers');
                for (var i in headers) {
                    attributeOptions.appendChild(this.createOption(i));
                }
            }
        }, this);
    }
[…]As we are building on the existing functionality, we extend our createButton method to support styling buttons. For this, we need to pass the layer object to it, obligating us to add a new argument to it:
layerTree.prototype.createButton = function (elemName, elemTitle, elemType, layer) {
    […]
        case 'stylelayer':
            var _this = this;
            buttonElem.textContent = elemTitle;
            if (elemTitle === 'Default') {
                buttonElem.addEventListener('click', function () {
                    layer.setStyle(layer.get('style'));
                });
            } else {
                var styleFunction = elemTitle === 'Graduated' ? this.styleGraduated : this.styleCategorized;
                buttonElem.addEventListener('click', function () {
                    var attribute = buttonElem.parentNode.querySelector('select').value;
                    styleFunction.call(_this, layer, attribute);
                });
            }
            return buttonElem;
        […]
};
We shape our default styling button to its final form, restoring the default style stored in the layer object. The other buttons invoke the appropriate styling method. As we grab those methods out of their default context, we have to manually provide them with the JavaScript's call method and the reference to our layer tree.
In this step, we need to calculate the color ramps for the classes first. We calculate a linear transition between two arbitrary colors. To calculate the colors for the different classes, we use an RGB color generator:
layerTree.prototype.graduatedColorFactory = function (classNum, rgb1, rgb2) {
var colors = [];
var steps = classNum - 1;
var redStep = (rgb2[0] - rgb1[0]) / steps;
var greenStep = (rgb2[1] - rgb1[1]) / steps;
var blueStep = (rgb2[2] - rgb1[2]) / steps;
for (var i = 0; i < steps; i += 1) {
var red = Math.ceil(rgb1[0] + redStep * i);
var green = Math.ceil(rgb1[1] + greenStep * i);
var blue = Math.ceil(rgb1[2] + blueStep * i);
colors.push([red, green, blue, 1]);
}
colors.push([rgb2[0], rgb2[1], rgb2[2], 1]);
return colors;
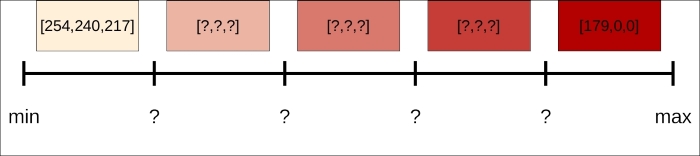
};As we have colors for the first and the last class already, we only have to partition the intervals of the color components to one part less than the number of classes we need:
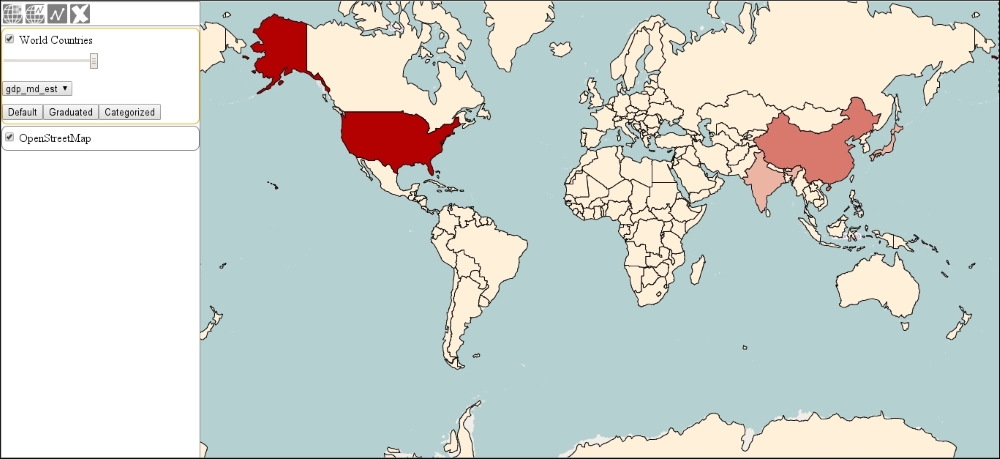
Next, we can start to write our styling function. Firstly, we calculate some statistics based on the input attribute and generate a linear gradient accordingly:
layerTree.prototype.styleGraduated = function (layer, attribute) {
    if (layer.get('headers')[attribute] === 'string') {
        this.messages.textContent = 'A numeric column is required for graduated symbology.';
    } else {
        var attributeArray = [];
        layer.getSource().forEachFeature(function (feat) {
            attributeArray.push(feat.get(attribute));
        });
        var max = Math.max.apply(null, attributeArray);
        var min = Math.min.apply(null, attributeArray);
        var step = (max - min) / 5;
var colors = this.graduatedColorFactory(5, [254, 240, 217], [179, 0, 0]);Finally, we build a style function based on the generated colors and calculated intervals:
        layer.setStyle(function (feature, res) {
            var property = feature.get(attribute);
            var color = property < min + step * 1 ? colors[0] :
                property < min + step * 2 ? colors[1] :
                property < min + step * 3 ? colors[2] :
                property < min + step * 4 ? colors[3] : colors[4];
            var style = new ol.style.Style({
                stroke: new ol.style.Stroke({
                    color: [0, 0, 0, 1],
                    width: 1
                }),
                fill: new ol.style.Fill({
                    color: color
                })
            });
            return [style];
        });
    }
};
Remember our assumptions: we can only style polygons with this method with five intervals and a predefined start and end color. In order to make a general styling method, you have to make a lot of checks and validations. If you test this part of the application, you can create choropleth maps with the numeric attributes:
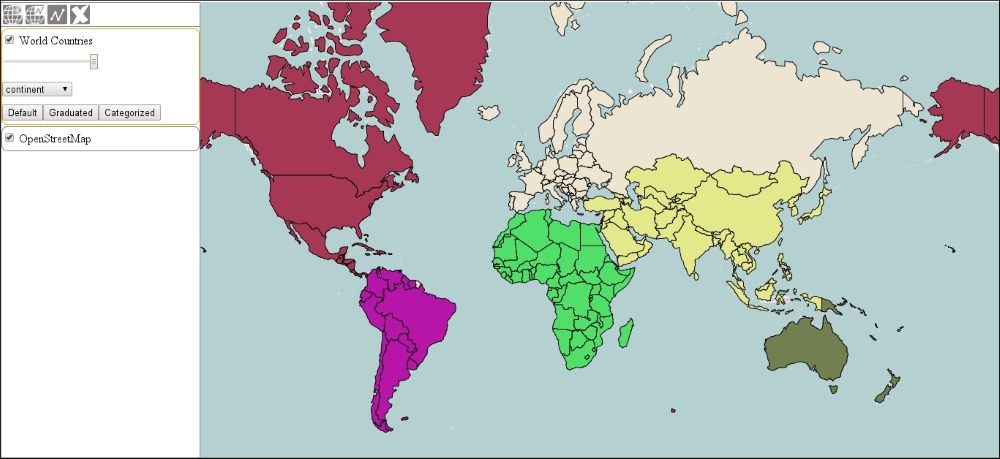
For a categorized symbology, we only need to collect the different attribute values from the features and assign random colors to them. For this purpose, we use a random color generator function:
layerTree.prototype.randomHexColor = function() {
    return '#' + Math.floor(Math.random() * 16777215).toString(16);
};
Note
This simple method can work because the Math.random method returns a floating point number between 0 and 1. The biggest hexadecimal value for a color is 0xFFFFFF. Its decimal value is 16777215. Finally, the Number.prototype.toString method accepts a radix argument to support conversions between different numeral systems.
Next, we can collect the different attribute values and generate a random color for each of them:
layerTree.prototype.styleCategorized = function (layer, attribute) {
    var attributeArray = [];
    var colorArray = [];
    var randomColor;
    layer.getSource().forEachFeature(function (feat) {
        var property = feat.get(attribute).toString();
        if (attributeArray.indexOf(property) === -1) {
            attributeArray.push(property);
            do {
                randomColor = this.randomHexColor();
            } while (colorArray.indexOf(randomColor) !== -1);
            colorArray.push(randomColor);
        }
    }, this);
Our method builds two consequent arrays, where the indices of the attribute values and the colors match. This way, we can easily check whether a newly generated color already exists. If it does, the method just simply generates a new color and checks again. Now that we have the attribute and color arrays, we can build the style function:
    layer.setStyle(function (feature, res) {
        var index = attributeArray.indexOf(feature.get(attribute).toString());
        var style = new ol.style.Style({
            stroke: new ol.style.Stroke({
                color: [0, 0, 0, 1],
                width: 1
            }),
            fill: new ol.style.Fill({
                color: colorArray[index]
            })
        });
        return [style];
    });
};
In the style function, we check every feature's corresponding attribute value against the attribute array, and assign a color based on the returned index number. If you save the code and load it up, you can test our new styling functionality. If you choose the continent column for the categorized styling, you will get the following result: