Table of Contents for
Mastering OpenLayers 3
 Mastering OpenLayers 3
Published by
Packt Publishing, 2016
Mastering OpenLayers 3
Published by
Packt Publishing, 2016
- Cover
- Table of Contents
- Mastering OpenLayers 3
- Mastering OpenLayers 3
- Credits
- About the Author
- About the Reviewer
- www.PacktPub.com
- Preface
- What you need for this book
- Who this book is for
- Conventions
- Reader feedback
- Customer support
- 1. Creating Simple Maps with OpenLayers 3
- Structure of OpenLayers 3
- Building the layout
- Using the API documentation
- Debugging the code
- Summary
- 2. Applying Custom Styles
- Customizing the default appearance
- Styling vector layers
- Customizing the appearance with JavaScript
- Creating a WebGIS client layout
- Summary
- 3. Working with Layers
- Building a layer tree
- Adding layers dynamically
- Adding vector layers with the File API
- Adding vector layers with a library
- Removing layers dynamically
- Changing layer attributes
- Changing the layer order with the Drag and Drop API
- Clearing the message bar
- Summary
- 4. Using Vector Data
- Accessing attributes
- Setting attributes
- Validating attributes
- Creating thematic layers
- Saving vector data
- Saving with WFS-T
- Modifying the geometry
- Summary
- 5. Creating Responsive Applications with Interactions and Controls
- Building the toolbar
- Mapping interactions to controls
- Building a set of feature selection controls
- Adding new vector layers
- Building a set of drawing tools
- Modifying and snapping to features
- Creating new interactions
- Building a measuring control
- Summary
- 6. Controlling the Map – View and Projection
- Customizing a view
- Constraining a view
- Creating a navigation history
- Working with extents
- Rotating a view
- Changing the map's projection
- Creating custom animations
- Summary
- 7. Mastering Renderers
- Using different renderers
- Creating a WebGL map
- Drawing lines and polygons with WebGL
- Blending layers
- Clipping layers
- Exporting a map
- Creating a raster calculator
- Creating a convolution matrix
- Clipping a layer with WebGL
- Summary
- 8. OpenLayers 3 for Mobile
- Responsive styling with CSS
- Generating geocaches
- Adding device-dependent controls
- Vectorizing the mobile version
- Making the mobile application interactive
- Summary
- 9. Tools of the Trade – Integrating Third-Party Applications
- Exporting a QGIS project
- Importing shapefiles
- Spatial analysis with Turf
- Spatial analysis with JSTS
- 3D rendering with Cesium
- Summary
- 10. Compiling Custom Builds with Closure
- Configuring Node JS
- Compiling OpenLayers 3
- Bundling an application with OpenLayers 3
- Extending OpenLayers 3
- Creating rich documentation with JSDoc
- Summary
- Index
We have come to our last example in this chapter. In this example, called ch05_measure, we will harness the full power of interactions and build a completely custom one in which we manually handle every event type. This example has three parts, so stay sharp. Firstly, as usual, we create a CSS rule for our new control button:
.toolbar .ol-measure button {
    background-image: url(../../res/button_measure.png);
}
One button is enough for this control, as we will implement two functionalities (length and area measurement) into a single interaction.
In the interaction's constructor, we accept two properties in an object literal: a reference to our map object and an optional style object or style function. As interactions do not have the exposed setMap and getMap methods, we need a reference to our map; thus, if it is not there, we return an error. If the style is not defined, we simply assign a default style, which is a simplified version of the OpenLayers 3 default editing style:
ol.interaction.Measure = function (opt_options) {
    var options = opt_options || {};
    if (!(options.map instanceof ol.Map)) {
        throw new Error('Please provide a valid OpenLayers 3 map');
    }
    var style = opt_options.style || new ol.style.Style({
        image: new ol.style.Circle({
            radius: 6,
            fill: new ol.style.Fill({
                color: [0, 153, 255, 1]
            }),
            stroke: new ol.style.Stroke({
                color: [255, 255, 255, 1],
                width: 1.5
            })
        }),
        stroke: new ol.style.Stroke({
            color: [0, 153, 255, 1],
            width: 3
        }),
        fill: new ol.style.Fill({
            color: [255, 255, 255, 0.5]
        })
    });
    var cursorFeature = new ol.Feature();
    var lineFeature = new ol.Feature();
    var polygonFeature = new ol.Feature();
We also create some empty sketch features. Next, we call the interaction's factory constructor with our custom handleEvent handler function:
    ol.interaction.Interaction.call(this, {
        handleEvent: function (evt) {
            switch (evt.type) {
                case 'pointermove':
                    cursorFeature.setGeometry(new ol.geom.Point(evt.coordinate));
                    var coordinates = this.get('coordinates');
                    coordinates[coordinates.length - 1] = evt.coordinate;
                    if (this.get('session') === 'area') {
                        if (coordinates.length < 3) {
                            lineFeature.getGeometry().setCoordinates(coordinates);
                        } else {
                            polygonFeature.getGeometry().setCoordinates([coordinates]);
                        }
                    }
                    else if (this.get('session') === 'length') {
                        lineFeature.getGeometry().setCoordinates(coordinates);
                    }
break;Firstly, we handle the move events. If we move our cursor while the interaction is active, a point feature is displayed on our cursor, which is similar to the draw interaction. Furthermore, it grabs a reference to our stored coordinate array representing the sketch feature. It switches the array's last pair of coordinates to the pointer's current location, pulling the last vertex of the sketch with the cursor.
If we are in a drawing session, it checks whether we are drawing a line or a polygon. If it is a polygon, it draws a line until our polygon is displayable (has a minimum of three vertices). After this, it draws a polygon. If it is a line, it simply draws a line.
Next, we handle click events. Basically, this is a simple function that starts a drawing session or appends new coordinates to the coordinate array when we are in a session:
                case 'click':
                    if (!this.get('session')) {
                        if (evt.originalEvent.shiftKey) {
                            this.set('session', 'area');
                            polygonFeature.setGeometry(new ol.geom.Polygon([[[0, 0]]]));
                        } else {
                            this.set('session', 'length');
                        }
                        lineFeature.setGeometry(new ol.geom.LineString([[0, 0]]));
                        this.set('coordinates', [evt.coordinate]);
                    }
                    this.get('coordinates').push(evt.coordinate);
                    return false;
If we are not in a session, we check the original browser event. If the Shift key is pressed, we start an area measurement, otherwise we measure a length. This is the part where we set up the geometries of the features. Note that, at this point, we only define some dummy geometries so they can pass the library's error checks. We will dynamically overwrite them with our stored coordinate array later.
If we start a new drawing session, as you can see, we add two pairs of coordinates to our array. This way, we can store the last clicked coordinate safe and sound, while we also prepare a new pair of coordinates to be modified by the move handler. Finally, we return false, as we don't want our interaction to be hooked up with some other interaction when we click on the map.
Note
As the last pair of coordinates only indicate the place that the move handler should modify, its original form won't influence the shape of our geometry; therefore, the results in the accuracy of our measurement. You can replace the penultimate line with this.get('coordinates').push(['chicken', 'nuggets']); and the interaction will still work as intended.
Next, we handle the double-click events. We stop the drawing, calculate the results, and restore every significant property to their default values:
                case 'dblclick':
                    var unit;
                    if (this.get('session') === 'area') {
                        var area = polygonFeature.getGeometry().getArea();
                        if (area > 1000000) {
                            area = area / 1000000;
                            unit = 'km²';
                        } else {
                            unit = 'm²';
                        }
                        this.set('result', {
                            type: 'area',
                            measurement: area,
                            unit: unit
                        });
If we measure an area, we calculate the polygon's area, convert the result if necessary, and then update the result property:
                    } else {
                        var length = lineFeature.getGeometry().getLength();
                        if (length > 1000) {
                            length = length / 1000;
                            unit = 'km';
                        } else {
                            unit = 'm';
                        }
                        this.set('result', {
                            type: 'length',
                            measurement: length,
                            unit: unit
                        });
                    }
If there is any other case, we must be dealing with a length measurement. We calculate the line feature's length and follow our previous logic. In this handler, we also return false as we do not want to propagate the event. Otherwise, in a default setting, the event would be propagated to ol.interaction.DoubleClickZoom, and we would unintentionally zoom into the map. If we have any other events, we just return true propagating the event to other interactions:
Note
With regard to unit notations, we currently only deal with metric coordinate systems. As the getLength and getArea methods return measurements in the projected plane, the interaction in its current form returns correct results in any coordinate system (until it converts them), but wrong units in non-metric systems.
                    cursorFeature.setGeometry(null);
                    lineFeature.setGeometry(null);
                    polygonFeature.setGeometry(null);
                    this.setProperties({
                        session: null,
                        coordinates: []

                    });
                    return false;
            }
            return true;
        }
    });
Finally, we remove the overlay when the interaction is inactive, and add it to the map when it is active. We also set up the default properties and the inheritance. It is important to set the line's and the polygon's geometry to null when we deactivate the interaction. This way, if we disable the interaction during a drawing session, it won't get stuck:
    this.on('change:active', function (evt) {
        if (this.getActive()) {
            this.get('overlay').setMap(this.get('map'));
        } else {
            this.get('overlay').setMap(null);
            this.set('session', null);
            lineFeature.setGeometry(null);
            polygonFeature.setGeometry(null);
        }
    });
    this.setProperties({
        overlay: new ol.layer.Vector({
            source: new ol.source.Vector({
                features: [cursorFeature, lineFeature, polygonFeature]
            }),
            style: style
        }),
        map: options.map,
        session: null,
        coordinates: [],
        result: null
    });
};
ol.inherits(ol.interaction.Measure, ol.interaction.Interaction);Only one thing is left to do: we add a measurement control to our map. We do it in our init function as this control is not part of the editing toolbar. We also assign an event listener to it. If the result property changes, we annotate the results. As we saved the overlay layer as a property too, you can add the newly created features to a permanent layer in the same event before they become null:
var measureControl = new ol.control.Interaction({
    label: ' ',
    tipLabel: 'Measure distances and areas',
    className: 'ol-measure ol-unselectable ol-control',
    interaction: new ol.interaction.Measure({
        map: map
    })
});
measureControl.get('interaction').on('change:result', function (evt) {
    var result = evt.target.get('result');
    tree.messages.textContent = result.measurement + ' ' + result.unit;
});

tools.addControl(measureControl);
If you save the code and load it up, you can see our measurement control in action:
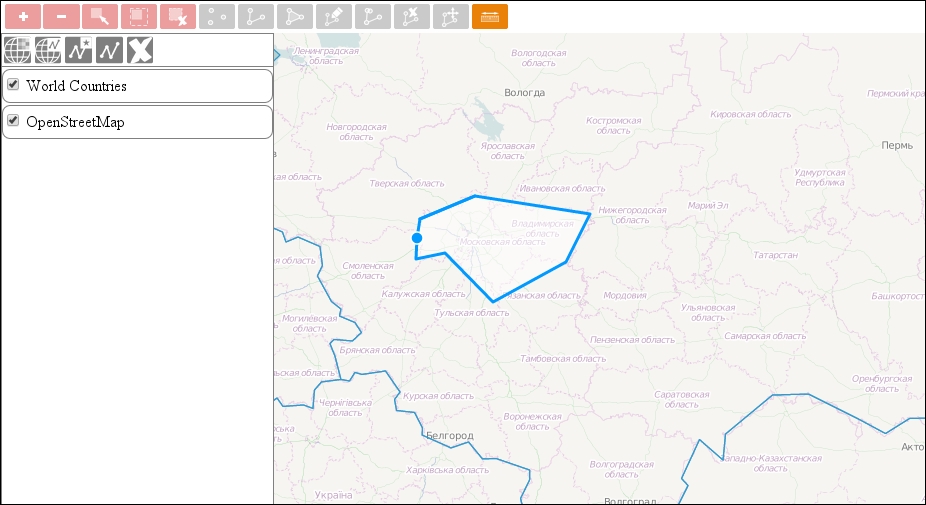
Tip
You can keep the geometry of the last measurement with some modifications in the code. For additional help, you can see the official example at http://www.openlayers.org/en/master/examples/measure.html. It also provides some great styling tips.
One thing I know for sure, Hungary's exact size is 93030 km2 and it does not correspond with 207186 km2 measured with our tool. Of course, the measurement wasn't precise, but the difference is by orders of magnitude. As you must have known, projections distort spatial data in more ways. There are better and worse projections from this aspect, and Web Mercator is one of the worst. In some applications, measuring in the projected plane is sufficient, or it is the expected behavior, but in others, more precise measurements are required. The good news is: you can calculate lengths and areas accurately in basically any projection.
The next example is in a separate JavaScript file, called ch05_measure_geodesic.js. You can link it to the example's HTML file (ch05_measure.html) or modify our interaction in place. In this example, we will modify the interaction in such a way that it will always calculate lengths and areas of a sphere. Our sphere will have a radius of the semi-major axis of the WGS 84 ellipsoid used by the EPSG:4326 projection. Firstly, we create the sphere inside our interaction:
ol.interaction.Measure = function (opt_options) {
    […]
    var sphere = new ol.Sphere(6378137);
    […]
Next, we modify our double-click handler where the calculations are done:
                case 'dblclick':
                    var unit;
                    var mapProjection = this.get('map').getView().getProjection();
                    if (this.get('session') === 'area') {
                        var lonLatPolygon = polygonFeature.getGeometry().transform(mapProjection, 'EPSG:4326');
                        var area = Math.abs(sphere.geodesicArea(lonLatPolygon.getCoordinates()[0]));
                        […]
                    } else {
                        var lonLatLine = lineFeature.getGeometry().transform(mapProjection, 'EPSG:4326');
                        var lineCoordinates = lonLatLine.getCoordinates();
                        var length = 0;
                        for (var i = 0; i < lineCoordinates.length - 1; i += 1) {
                            length += sphere.haversineDistance(lineCoordinates[i], lineCoordinates[i + 1]);
                        }
                        […]
When we measure a sphere, we have to provide the coordinates in a longitude/latitude format. Therefore, we have to transform the coordinates first from whatever projection we use to EPSG:4326. For calculating areas, we have an easy job. We simply have to pass a polygon's coordinates to our sphere's geodesicArea method.
For calculating lengths, we can use the sphere's haversineDistance method. As it calculates length between two given pairs of coordinates, we have to iterate through the transformed line feature's coordinates.
If you update your interaction with these modifications, you will see that now you can measure quite accurately. The new result for Hungary's area is 93051 km2, which is quite good.
The Haversine formula can be considered as quite accurate; however, in a few use cases, millimeters to a 10th of a meter precision is required. In such cases, using spherical geometry is not accurate enough.
An ellipsoidal approach, however, can provide the required accuracy at the expense of performance. There is a third JavaScript file for this example, called ch05_measure_vincenty.js. In this example, we will use a WGS 84 ellipsoid to define the shape of the Earth and measure distances on it with the Vincenty formula. As the ol.Ellipsoid class is not exposed in the compiled library, we have to use the ol-debug.js file. As the ellipsoid class was removed from OpenLayers 3.9.0, we use the debug file from version 3.8.2.
Firstly, we define an ellipsoid in our interaction. The constructor needs the length of the ellipsoid's semi-major axis in meters and also its flattening as arguments:
ol.interaction.Measure = function (opt_options) {
    […]
    var ellipsoid = new ol.Ellipsoid(6378137, 1 / 298.257223563);
    […]
Next, we only have to modify the calculations of the length measurement:
                case 'dblclick':
                    […]
                    } else {
                        […]
                        for (var i = 0; i < lineCoordinates.length - 1; i += 1) {
                            length += ellipsoid.vincentyDistance(lineCoordinates[i], lineCoordinates[i + 1]);
                        […]
                    }
                    […]
Now, our application can calculate distances and areas as accurately as OpenLayers 3 allows it to.