Table of Contents for
Mastering OpenLayers 3
 Mastering OpenLayers 3
Published by
Packt Publishing, 2016
Mastering OpenLayers 3
Published by
Packt Publishing, 2016
- Cover
- Table of Contents
- Mastering OpenLayers 3
- Mastering OpenLayers 3
- Credits
- About the Author
- About the Reviewer
- www.PacktPub.com
- Preface
- What you need for this book
- Who this book is for
- Conventions
- Reader feedback
- Customer support
- 1. Creating Simple Maps with OpenLayers 3
- Structure of OpenLayers 3
- Building the layout
- Using the API documentation
- Debugging the code
- Summary
- 2. Applying Custom Styles
- Customizing the default appearance
- Styling vector layers
- Customizing the appearance with JavaScript
- Creating a WebGIS client layout
- Summary
- 3. Working with Layers
- Building a layer tree
- Adding layers dynamically
- Adding vector layers with the File API
- Adding vector layers with a library
- Removing layers dynamically
- Changing layer attributes
- Changing the layer order with the Drag and Drop API
- Clearing the message bar
- Summary
- 4. Using Vector Data
- Accessing attributes
- Setting attributes
- Validating attributes
- Creating thematic layers
- Saving vector data
- Saving with WFS-T
- Modifying the geometry
- Summary
- 5. Creating Responsive Applications with Interactions and Controls
- Building the toolbar
- Mapping interactions to controls
- Building a set of feature selection controls
- Adding new vector layers
- Building a set of drawing tools
- Modifying and snapping to features
- Creating new interactions
- Building a measuring control
- Summary
- 6. Controlling the Map – View and Projection
- Customizing a view
- Constraining a view
- Creating a navigation history
- Working with extents
- Rotating a view
- Changing the map's projection
- Creating custom animations
- Summary
- 7. Mastering Renderers
- Using different renderers
- Creating a WebGL map
- Drawing lines and polygons with WebGL
- Blending layers
- Clipping layers
- Exporting a map
- Creating a raster calculator
- Creating a convolution matrix
- Clipping a layer with WebGL
- Summary
- 8. OpenLayers 3 for Mobile
- Responsive styling with CSS
- Generating geocaches
- Adding device-dependent controls
- Vectorizing the mobile version
- Making the mobile application interactive
- Summary
- 9. Tools of the Trade – Integrating Third-Party Applications
- Exporting a QGIS project
- Importing shapefiles
- Spatial analysis with Turf
- Spatial analysis with JSTS
- 3D rendering with Cesium
- Summary
- 10. Compiling Custom Builds with Closure
- Configuring Node JS
- Compiling OpenLayers 3
- Bundling an application with OpenLayers 3
- Extending OpenLayers 3
- Creating rich documentation with JSDoc
- Summary
- Index
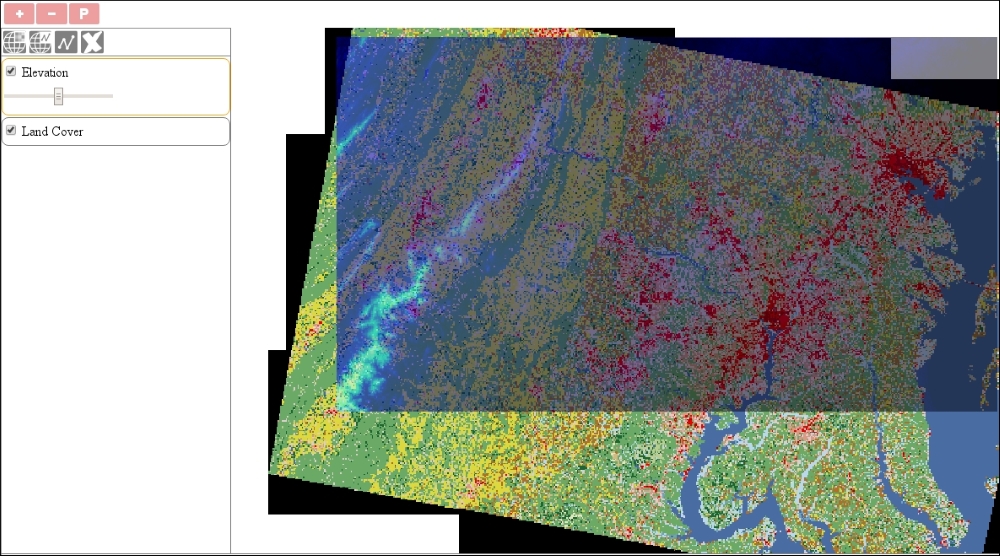
The third useful canvas operation we will discuss is saving the content of the canvas as an image. As you may already know, traditionally, files can be saved by downloading them from a server. There are serious security considerations behind the restriction of saving anything to the hard drive that's created on the client side. However, there is no restriction in displaying a dynamically created image.
In this example, called ch07_print, we will create a control that dynamically creates an image based on the map canvas's context and opens it in a new tab. This way, we can download the image just like any other plain image from a web page. First, we will create a new control to save map states:
ol.control.Print = function (opt_options) {
    var options = opt_options || {};
    var _this = this;
    var controlDiv = document.createElement('div');
    controlDiv.className = options.class || 'ol-print ol-unselectable ol-control';
    var controlButton = document.createElement('button');
    controlButton.textContent = options.label || 'P';
    controlButton.title = options.tipLabel || 'Print map';
    var dataURL;
    controlButton.addEventListener('click', function (evt) {
        _this.getMap().once('postcompose', function (evt) {
            var canvas = evt.context.canvas;
            dataURL = canvas.toDataURL('image/png');
        });
        _this.getMap().renderSync();
        window.open(dataURL, '_blank');
        dataURL = null;
    });
    controlDiv.appendChild(controlButton);
    ol.control.Control.call(this, {
        element: controlDiv,
        target: options.target
    });
};
ol.inherits(ol.control.Print, ol.control.Control);
The control is very simple. If we push the button, it registers a one-time listener to the map object and converts the content of its canvas to a png image. More precisely, it converts it to a Base64 encoded URL of the png image, which can be opened by browsers, just like regular websites. After we have the URL, we call a synchronous rendering frame, making sure that the event occurs before we try to open our image. Finally, we simply open our image in a new tab.
Next, we modify our map constructor a little bit. We deploy two new layers, adjust their views, and add our new control:
 map = new ol.Map({
    target: 'map',
    layers: [
        new ol.layer.Tile({
            source: new ol.source.TileWMS({
                url: 'http://demo.opengeo.org/geoserver/wms',
                params: {
                    layers: 'ned',
                    format: 'image/png'
                },
                wrapX: false,
                crossOrigin: 'anonymous'
            }),
            name: 'Elevation'
        }),
        new ol.layer.Tile({
            source: new ol.source.TileWMS({
                url: 'http://demo.opengeo.org/geoserver/wms',
                params: {
                    layers: 'nlcd',
                    format: 'image/png'
                },
                wrapX: false,
                crossOrigin: 'anonymous'
            }),
            name: 'Land Cover'
        })
    ],
    controls: [
        […]
        new ol.control.Print({
            target: 'toolbar'
        })
    ],
    view: new ol.View({
        center: [-8604363.40000572, 4741541.738586053],
        zoom: 9
    })
});
As you can see, we used an extra property when we constructed the layer objects. The crossOrigin property is very important if we want to access the pixel values of the canvas. This is also a security consideration that does not let us manipulate or export the content of a canvas if we have used a non-CORS image at any point in time. To mark the images of a layer as cross origin, we only have to set the layer's crossOrigin property to anonymous. If we do not implement this step, we end up with a tainted canvas, which we cannot export.
If you save the example and load it up, you can open the map's content in the form of a picture in a new tab: