Table of Contents for
Mastering OpenLayers 3
 Mastering OpenLayers 3
Published by
Packt Publishing, 2016
Mastering OpenLayers 3
Published by
Packt Publishing, 2016
- Cover
- Table of Contents
- Mastering OpenLayers 3
- Mastering OpenLayers 3
- Credits
- About the Author
- About the Reviewer
- www.PacktPub.com
- Preface
- What you need for this book
- Who this book is for
- Conventions
- Reader feedback
- Customer support
- 1. Creating Simple Maps with OpenLayers 3
- Structure of OpenLayers 3
- Building the layout
- Using the API documentation
- Debugging the code
- Summary
- 2. Applying Custom Styles
- Customizing the default appearance
- Styling vector layers
- Customizing the appearance with JavaScript
- Creating a WebGIS client layout
- Summary
- 3. Working with Layers
- Building a layer tree
- Adding layers dynamically
- Adding vector layers with the File API
- Adding vector layers with a library
- Removing layers dynamically
- Changing layer attributes
- Changing the layer order with the Drag and Drop API
- Clearing the message bar
- Summary
- 4. Using Vector Data
- Accessing attributes
- Setting attributes
- Validating attributes
- Creating thematic layers
- Saving vector data
- Saving with WFS-T
- Modifying the geometry
- Summary
- 5. Creating Responsive Applications with Interactions and Controls
- Building the toolbar
- Mapping interactions to controls
- Building a set of feature selection controls
- Adding new vector layers
- Building a set of drawing tools
- Modifying and snapping to features
- Creating new interactions
- Building a measuring control
- Summary
- 6. Controlling the Map – View and Projection
- Customizing a view
- Constraining a view
- Creating a navigation history
- Working with extents
- Rotating a view
- Changing the map's projection
- Creating custom animations
- Summary
- 7. Mastering Renderers
- Using different renderers
- Creating a WebGL map
- Drawing lines and polygons with WebGL
- Blending layers
- Clipping layers
- Exporting a map
- Creating a raster calculator
- Creating a convolution matrix
- Clipping a layer with WebGL
- Summary
- 8. OpenLayers 3 for Mobile
- Responsive styling with CSS
- Generating geocaches
- Adding device-dependent controls
- Vectorizing the mobile version
- Making the mobile application interactive
- Summary
- 9. Tools of the Trade – Integrating Third-Party Applications
- Exporting a QGIS project
- Importing shapefiles
- Spatial analysis with Turf
- Spatial analysis with JSTS
- 3D rendering with Cesium
- Summary
- 10. Compiling Custom Builds with Closure
- Configuring Node JS
- Compiling OpenLayers 3
- Bundling an application with OpenLayers 3
- Extending OpenLayers 3
- Creating rich documentation with JSDoc
- Summary
- Index
In the next example, called ch07_convolution, we will implement a control, which can apply a filter on a single image. We will hardcode a Sobel filter for this example; however, based on the implementation, you will be able to use any kind of filter, even dynamically. Our implementation will have three stages:
- Converting the image to grayscale
- Applying the Sobel filter
- Normalizing the image
Before creating the control, let's discuss how convolution works in a nutshell. When we convolve an image, we calculate some sort of statistics from the image matrix that is based on every pixel's (or raster's) neighborhood. This is why this method is also referred to as focal statistics or a moving window in geoinformatics. There are two things we need to convolve an image: the pixel data arranged in a matrix and a small matrix with weights in it, which is called a kernel. We apply the kernel to every cell in our image and calculate its new value based on the values of its neighbors multiplied by the corresponding kernel value:
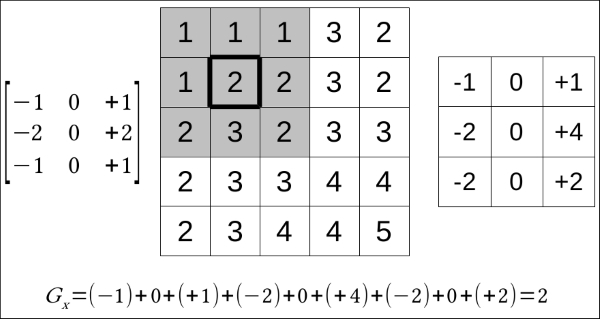
After the operation, we will have a matrix that is equal to the size of the kernel. The matrix contains the values of the original pixel and its neighborhood, which are weighted by the kernel values. If we add these values, we will get the new value for our current cell. The preceding kernel is the horizontal part of a 3 x 3 Sobel filter.
There are tons of cases where applying a convolution matrix to an RGB image just does not work out. In raster calculations or raster algebra, we operated on single band images of various types. This is also the case with the Sobel filter. As it detects edges (that is, the vertical and horizontal changes in pixel values), the easiest and most appropriate way is to clamp our image to a single 8-bit band. Of course, sometimes, storing values in a single byte is just not enough; in such cases, you can create a temporal array with appropriate values. First, we will create the control button:
ol.control.Convolve = function (opt_options) {
    var options = opt_options || {};
    var _this = this;
    var controlDiv = document.createElement('div');
    controlDiv.className = options.class || 'ol-convolve ol-unselectable ol-control';
    var controlButton = document.createElement('button');
    controlButton.textContent = options.label || 'C';
    controlButton.title = options.tipLabel || 'Convolve bottom layer';
Next, we will define a function in the control, which converts an input RGB matrix to an 8-bit one with the help of an averaging method:
    var toGrayScale = function (inputArray) {
        for (var i = 0; i < inputArray.length; i += 4) {
            var grayScaleValue = (inputArray[i] + inputArray[i + 1] + inputArray[i + 2]) / 3;
            inputArray[i] = grayScaleValue;
            inputArray[i + 1] = grayScaleValue;
            inputArray[i + 2] = grayScaleValue;
        }
    };
As we only change one pixel at a time, we can overwrite the original values of the provided array. Rounding is not necessary in this case as we operate on typed arrays, which we will see in detail later in the chapter. There is only one consideration that we have to make. As browsers can only think in the RGB color space, we must assign the calculated value to every color band. This way, we end up in a grayscale image. We step our loop with a value of 4 because we get a simple array containing every pixel's RGBA (red, green, blue, and alpha) values in the correct pixel order.
Note
There are two more well-known methods to convert an RGB image to an 8-bit image (desaturating). The first one is called the lightness method, which averages the biggest and smallest value from an RGB pixel. The second one is called the luminosity method, which weighs the values based on the color sensitivity of our eyes. The formula in this case is 0.21 * R + 0.72 * G + 0.07 * B.
Next, we create a function in our control that applies the Sobel filter to an input pixel and returns its new edge detected value:
    var applySobel = function (inputArray, index, width) {
        var nh = [inputArray[index - width - 4],
            inputArray[index - width],
            inputArray[index - width + 4],
            inputArray[index - 4],
            inputArray[index],
            inputArray[index + 4],
            inputArray[index + width - 4],
            inputArray[index + width],
            inputArray[index + width + 4]];
        for (var i = 0; i < nh.length; i += 1) {
            if (nh[i] === undefined) {
                nh[i] = inputArray[index];
            }
        }
        var hFilter = nh[0] + 2 * nh[1] + nh[2] - nh[6] - 2 * nh[7] - nh[8];
        var vFilter = nh[2] + 2 * nh[5] + nh[8] - nh[6] - 2 * nh[3] - nh[0];
        var pixelValue = Math.sqrt(Math.pow(hFilter, 2) + Math.pow(vFilter, 2));
        return 255 - pixelValue;
    };
Our function accepts three parameters. We must grab a reference to the array first as we have to know the values of the input pixel's neighbors. Secondly, we request the current index, which describes the position of our current pixel. Finally, we need a width parameter, also referred to as a stride, which is the numeric representation of the width of the image. This number tells us how many pixels we need to go forward or backward in order to get a pixel above or below our input pixel.
As we have every parameter needed to locate the current pixel's neighborhood, we can set up a temporal array, representing the matrix, which we will weight with a kernel. The Sobel filter has two kernels: one for horizontal edge detection and one for vertical edge detection. In this example, we will hardcode the weighting for the sake of simplicity.
There is one interesting problem we have to deal when we use a convolution matrix. On the edges of the image, we cannot grab a reference to every pixel in the kernel. There are several methods we can use in this particular case. We can shrink the image by n – 2, where n stands for the size of the kernel; however, this method is not simple, especially with OpenLayers 3. Alternatively, we can extrapolate our image, which is easier to implement. In our simple implementation, we do not extrapolate those values properly that are based on the whole neighborhood; we just default it to the current pixel value.
The last step of calculating the final value of the pixel is getting the geometric mean of the two filter values. This will automatically clamp our value to a byte range. Rounding off the value is still not necessary as the typed array will do this for us automatically.
When the pixel values are finely distributed, the result (display model) is visually appealing. We have a black contour on hard edges and a white representation on homogeneous pixels. However, as we can zoom into the image, this will not be the case on higher zoom levels. On a subset of the image, we can have only soft edges, and if we do not normalize the image, we will barely see them or won't see them at all. The normalization process stretches out the resulting pixel values to a predefined interval; in our case, this is from 0 to 255:
    var normalizeImage = function (inputArray, min, max) {
        for (var i = 0; i < inputArray.length; i+=4) {
            var newIntensity = (inputArray[i] - min) * 255 / (max - min);
            inputArray[i] = newIntensity;
            inputArray[i+1] = newIntensity;
            inputArray[i+2] = newIntensity;
        }
    };
In this example, we use a linear normalization method, which is the easiest to implement. There are some cases, however, when a normalized image with a linear method does not reflect the truth. If there is a nonlinear correlation between the image and the display model, you should use a more complex normalization method.
In the final step, we add an event listener to the control button, which creates a new raster layer and applies the Sobel filter to it:
controlButton.addEventListener('click', function (evt) {
        var layer = _this.getMap().getLayers().item(0);
        if (layer) {
            var raster = new ol.source.Raster({
                sources: [layer.getSource()],
                operationType: 'image',
                operation: function (image, data) {
                    var imageData = image[0];
                    var inputArray = imageData.data;
                    toGrayScale(inputArray);
                    var outputArray = new Uint8ClampedArray(inputArray);
                    var min = Infinity, max = -Infinity;
                    for (var i = 0; i < inputArray.length; i += 4) {
                        var edgeValue = calculateValue(inputArray, i, imageData.width * 4, imageData.height);
                        outputArray[i] = edgeValue;
                        outputArray[i + 1] = edgeValue;
                        outputArray[i + 2] = edgeValue;
                        min = outputArray[i] < min ? outputArray[i] : min;
                        max = outputArray[i] > max ? outputArray[i] : max;
                    }
                    normalizeImage(outputArray, min, max);
                    return new ImageData(outputArray, imageData.width, imageData.height);
                },
                lib: {
                    calculateValue: applySobel,
                    toGrayScale: toGrayScale,
                    normalizeImage: normalizeImage
                }
            });
            _this.getMap().addLayer(new ol.layer.Image({
                source: raster,
                name: 'Sobel filter'
            }));
        }
    });
    controlDiv.appendChild(controlButton);
    ol.control.Control.call(this, {
        element: controlDiv,
        target: options.target
    });
};
ol.inherits(ol.control.Convolve, ol.control.Control);
The process resembles the one described in the previous example; however, we now use the image operation type. There is a fundamental difference between the two operations. When we use a pixel type, we get one pixel value for every provided layer at a time, but in the case of image type, we get the whole image matrix for every provided layer at once.
As we use an image type operation, we get the whole image data, which is a JavaScript ImageData type object. The object contains the matrix of the image in its data property. The matrix is a little tricky as it must be a typed array. Typed arrays in JavaScript are low-level interfaces, granting access to real arrays stored in the memory. These arrays are the ones you are used to if you have used some lower-level languages, such as C. They are raw binary data whose content depends on the interpretation. To interpret these arrays, JavaScript offers some typed array constructors, such as 8, 16, or, 32-bit integer arrays or 32 and 64-bit floating point arrays. ImageData must contain Uint8ClampedArray more explicitly, which is an 8-bit unsigned integer array.
Tip
You can learn more about typed arrays in JavaScript on the MDN website at http://developer.mozilla.org/en-US/docs/Web/JavaScript/Typed_arrays.
In the raster operation, we convert the input array to grayscale. We can overwrite that array as the original RGB values of the input image can be discarded. For the output array, however, we must create a new array based on the grayscale one. As the convolution must be made on the original values, we must not make the modifications in place of original values. While we calculate the new values for our convolved image, we also store the minimum and maximum values of the current view: our image's range.
When we are done with the convolution, we normalize the image in place with the stored minimum and maximum values. Note that if you would like to create a GUI option to change the normalization algorithm, this operation should not overwrite the result. Next, we can return our new, modified image. This must be done with an ImageData object, which must contain the image's dimensions.
As seen in the previous example, we provide every external function that's used in the raster operation in the source's lib property. Finally, we construct our map with our new control in it. We also change the base layer to OpenStreetMap in order to see nice, sharp edges:
var map = new ol.Map({
target: 'map',
layers: [
new ol.layer.Tile({
source: new ol.source.OSM(),
name: 'OpenStreetMap'
})
],
controls: [
[…]
new ol.control.Convolve({
target: 'toolbar'
})
[…]
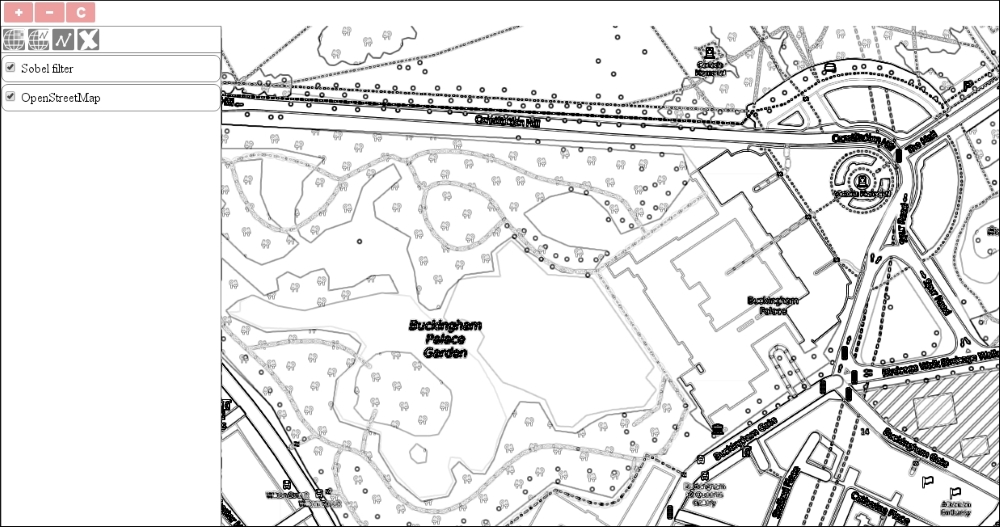
});If you save the code and use our new tool, you will see how edge detection works with the Sobel filter: