Table of Contents for
Mastering OpenLayers 3
 Mastering OpenLayers 3
Published by
Packt Publishing, 2016
Mastering OpenLayers 3
Published by
Packt Publishing, 2016
- Cover
- Table of Contents
- Mastering OpenLayers 3
- Mastering OpenLayers 3
- Credits
- About the Author
- About the Reviewer
- www.PacktPub.com
- Preface
- What you need for this book
- Who this book is for
- Conventions
- Reader feedback
- Customer support
- 1. Creating Simple Maps with OpenLayers 3
- Structure of OpenLayers 3
- Building the layout
- Using the API documentation
- Debugging the code
- Summary
- 2. Applying Custom Styles
- Customizing the default appearance
- Styling vector layers
- Customizing the appearance with JavaScript
- Creating a WebGIS client layout
- Summary
- 3. Working with Layers
- Building a layer tree
- Adding layers dynamically
- Adding vector layers with the File API
- Adding vector layers with a library
- Removing layers dynamically
- Changing layer attributes
- Changing the layer order with the Drag and Drop API
- Clearing the message bar
- Summary
- 4. Using Vector Data
- Accessing attributes
- Setting attributes
- Validating attributes
- Creating thematic layers
- Saving vector data
- Saving with WFS-T
- Modifying the geometry
- Summary
- 5. Creating Responsive Applications with Interactions and Controls
- Building the toolbar
- Mapping interactions to controls
- Building a set of feature selection controls
- Adding new vector layers
- Building a set of drawing tools
- Modifying and snapping to features
- Creating new interactions
- Building a measuring control
- Summary
- 6. Controlling the Map – View and Projection
- Customizing a view
- Constraining a view
- Creating a navigation history
- Working with extents
- Rotating a view
- Changing the map's projection
- Creating custom animations
- Summary
- 7. Mastering Renderers
- Using different renderers
- Creating a WebGL map
- Drawing lines and polygons with WebGL
- Blending layers
- Clipping layers
- Exporting a map
- Creating a raster calculator
- Creating a convolution matrix
- Clipping a layer with WebGL
- Summary
- 8. OpenLayers 3 for Mobile
- Responsive styling with CSS
- Generating geocaches
- Adding device-dependent controls
- Vectorizing the mobile version
- Making the mobile application interactive
- Summary
- 9. Tools of the Trade – Integrating Third-Party Applications
- Exporting a QGIS project
- Importing shapefiles
- Spatial analysis with Turf
- Spatial analysis with JSTS
- 3D rendering with Cesium
- Summary
- 10. Compiling Custom Builds with Closure
- Configuring Node JS
- Compiling OpenLayers 3
- Bundling an application with OpenLayers 3
- Extending OpenLayers 3
- Creating rich documentation with JSDoc
- Summary
- Index
Now that we are familiar with some of the most useful canvas manipulation methods, let's take a look at a renderer that is independent of any image manipulation. There is a very useful source object in the library that can take multiple sources as input and create a new image based on the provided operations. In this example, called ch07_rastcalc, we will use the ol.source.Raster class to build a basic RasterCalculator function.
To understand the limitations of raster manipulation in OpenLayers 3 or, basically, any web mapping application, we should discuss how rasters work in GIS. If you are familiar with the concept, you can skip this part. If not, this section can give you some basic, but valuable, information, which can help you evaluate better architectural patterns.
First of all, every raster can be translated to a simple matrix. Rasters have a resolution and consist of uniform cells. Therefore, if we know the resolution of a raster, we can handle the underlying data as a matrix, which we can also place in a coordinate reference system if we know the coordinates of one of its corners. Traditionally, this corner is the lower-left one. A raster can only contain one value for every cell it contains. This value can represent anything from elevation to any sort of statistical data. This type of value must be numeric but the subtype is not specified (although it must be uniform for the entire raster).
The main problem when working with rasters in browsers is that browsers can only think in the RGB color space. A browser cannot interpret raster data in its natural form; therefore, map servers convert rasters to a well-recognized RGB format (such as png, jpeg, or gif) and send images in these formats to the client. This way, we can only access the converted RGB values for every pixel of the raster, and without knowing the transformation method exactly, we cannot transform them back to their original values. We can transform them to single band values, making raster calculations possible and showing visually appealing results, but they will not represent the truth.
To sum it up, we can make raster calculations possible in the browser. However, as we do not know the original values by default, just the transformed RGB values, our transformations can only be proportionally correct. This can yield to visually appealing results, but the calculations can only be used to create previews. We can create a preview for an otherwise resource-intensive server-side calculation, thus making users not load the server when the result is clearly dissatisfying.
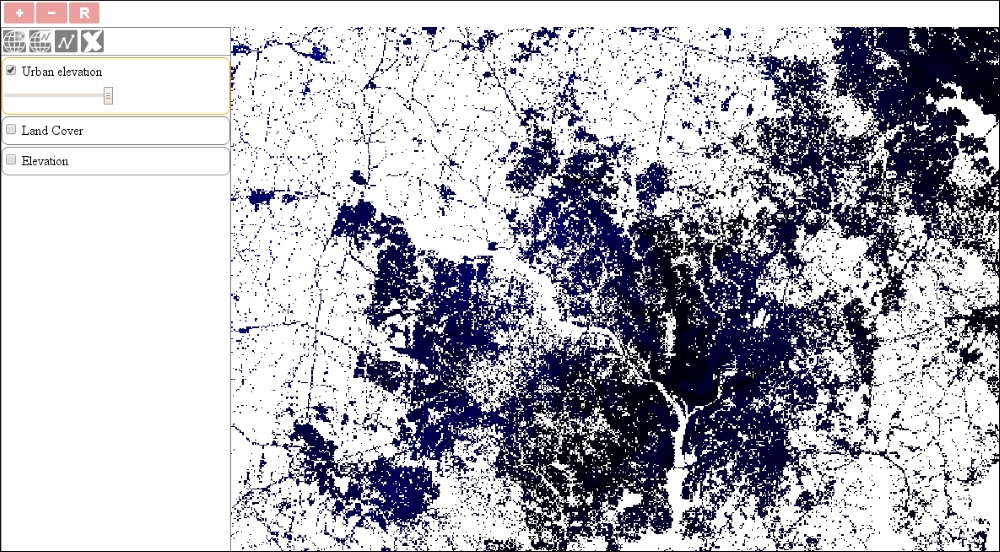
For this example, we will build a static calculator control. This control picks out shades of red from the first map (urban areas in the land classification layer) and keeps the second layer (elevation) only according to the pixels of first layer. In simpler terms, we will mask the elevation layer with the urban areas of the land classification layer. First, we will create the basics of our new control:
ol.control.RasterCalculator = function (opt_options) {
    var options = opt_options || {};
    var _this = this;
    var controlDiv = document.createElement('div');
    controlDiv.className = options.class || 'ol-rastercalc ol-unselectable ol-control';
    var controlButton = document.createElement('button');
    controlButton.textContent = options.label || 'R';
    controlButton.title = options.tipLabel || 'Calculate Raster';
Next, we have to write a filter function that checks an input pixel from the mask layer, and if the criteria for this pixel is met, it returns the pixel value of the second layer. If not, it sends back a fully transparent pixel:
    var filterPixel = function (pixels) {
        var inputPixel = pixels[0];
        var maskPixel = pixels[1];
        if (maskPixel[0] > maskPixel[1] && maskPixel[0] > maskPixel[2] && Math.abs(maskPixel[1] - maskPixel[2]) < 25) {
            return inputPixel;
        }
        return [0, 0, 0, 0];
};Next, we add an event listener to the button. If we click on it, our control creates a new layer with a raster source and calculates the layer based on two input layers:
    controlButton.addEventListener('click', function (evt) {
        var layer = _this.getMap().getLayers().item(0);
        var mask = _this.getMap().getLayers().item(1);
        if (layer && mask) {
            var raster = new ol.source.Raster({
                sources: [layer.getSource(), mask.getSource()],
                operationType: 'pixel',
                operation: function (pixels, data) {
                    return filter(pixels);
                },
                lib: {
                    filter: filterPixel
                }
            });
            _this.getMap().addLayer(new ol.layer.Image({
                source: raster,
                name: 'Urban elevation'
            }));
        }
    });
For the raster source, we have to provide an array of source objects. If we set the operationType attribute to pixels, we will get an array for the operation function with the overlapping pixel values of every provided source. The lib property is optional; however, it is utterly useful. We can separate the most resource-intensive calculations in separate functions and define them in the lib object. OpenLayers 3 can thread these functions via web workers but only if they are defined.
Finally, we finish our control with some routine commands and include it in our map constructor:
    controlDiv.appendChild(controlButton);
    ol.control.Control.call(this, {
        element: controlDiv,
        target: options.target
    });
};
ol.inherits(ol.control.RasterCalculator, ol.control.Control);
[…]
var map = new ol.Map({
    […]
    controls: [
        […]
        new ol.control.RasterCalculator({
            target: 'toolbar'
        })
    […]
});
If you save the code and try it in a browser, you will see our raster calculator in action. You can also try to perform more complex calculations on input images: