Table of Contents for
Mastering Wireshark 2

Version ebook / Retour

Cover image for bash Cookbook, 2nd Edition Mastering Wireshark 2 by Andrew Crouthamel Published by Packt Publishing, 2018
  1. Mastering Wireshark 2
  2. Title Page
  3. Copyright and Credits
  4. Mastering Wireshark 2
  5. Packt Upsell
  6. Why subscribe?
  7. PacktPub.com
  8. Contributor
  9. About the author
  10. Packt is searching for authors like you
  11. Table of Contents
  12. Preface
  13. Who this book is for
  14. What this book covers
  15. To get the most out of this book
  16. Download the color images
  17. Conventions used
  18. Get in touch
  19. Reviews
  20. Installing Wireshark 2
  21. Installation and setup
  22. Installing Wireshark on Windows
  23. Installing Wireshark on macOS
  24. Installing Wireshark on Linux
  25. Summary
  26. Getting Started with Wireshark
  27. What's new in Wireshark 2?
  28. Capturing traffic
  29. How to capture traffic
  30. Saving and exporting packets
  31. Annotating and printing packets
  32. Remote capture setup
  33. Prerequisites
  34. Remote capture usage
  35. Summary
  36. Filtering Traffic
  37. Berkeley Packet Filter (BPF) syntax
  38. Capturing filters
  39. Displaying filters
  40. Following streams
  41. Advanced filtering
  42. Summary
  43. Customizing Wireshark
  44. Preferences
  45. Appearance
  46. Layout
  47. Columns
  48. Fonts and colors
  49. Capture
  50. Filter buttons
  51. Name resolution
  52. Protocols
  53. Statistics
  54. Advanced
  55. Profiles
  56. Colorizing traffic
  57. Examples of colorizing traffic
  58. Example 1
  59. Example 2
  60. Summary
  61. Statistics
  62. TCP/IP overview
  63. Time values and summaries
  64. Trace file statistics
  65. Resolved addresses
  66. Protocol hierarchy
  67. Conversations
  68. Endpoints
  69. Packet lengths
  70. I/O graph
  71. Load distribution
  72. DNS statistics
  73. Flow graph
  74. Expert system usage
  75. Summary
  76. Introductory Analysis
  77. DNS analysis
  78. An example for DNS request failure
  79. ARP analysis
  80. An example for ARP request failure
  81. IPv4 and IPv6 analysis
  82. ICMP analysis
  83. Using traceroute
  84. Summary
  85. Network Protocol Analysis
  86. UDP analysis
  87. TCP analysis I
  88. TCP analysis II
  89. Graph I/O rates and TCP trends
  90. Throughput
  91. I/O graph
  92. Summary
  93. Application Protocol Analysis I
  94. DHCP analysis
  95. HTTP analysis I
  96. HTTP analysis II
  97. FTP analysis
  98. Summary
  99. Application Protocol Analysis II
  100. Email analysis
  101. POP and SMTP
  102. 802.11 analysis
  103. VoIP analysis
  104. VoIP playback
  105. Summary
  106. Command-Line Tools
  107. Running Wireshark from a command line
  108. Running tshark
  109. Running tcpdump
  110. Running dumpcap
  111. Summary
  112. A Troubleshooting Scenario
  113. Wireshark plugins
  114. Lua programming
  115. Determining where to capture
  116. Capturing scenario traffic
  117. Diagnosing scenario traffic
  118. Summary
  119. Other Books You May Enjoy
  120. Leave a review - let other readers know what you think

Flow graph

One of the coolest Statistics is flow graph.

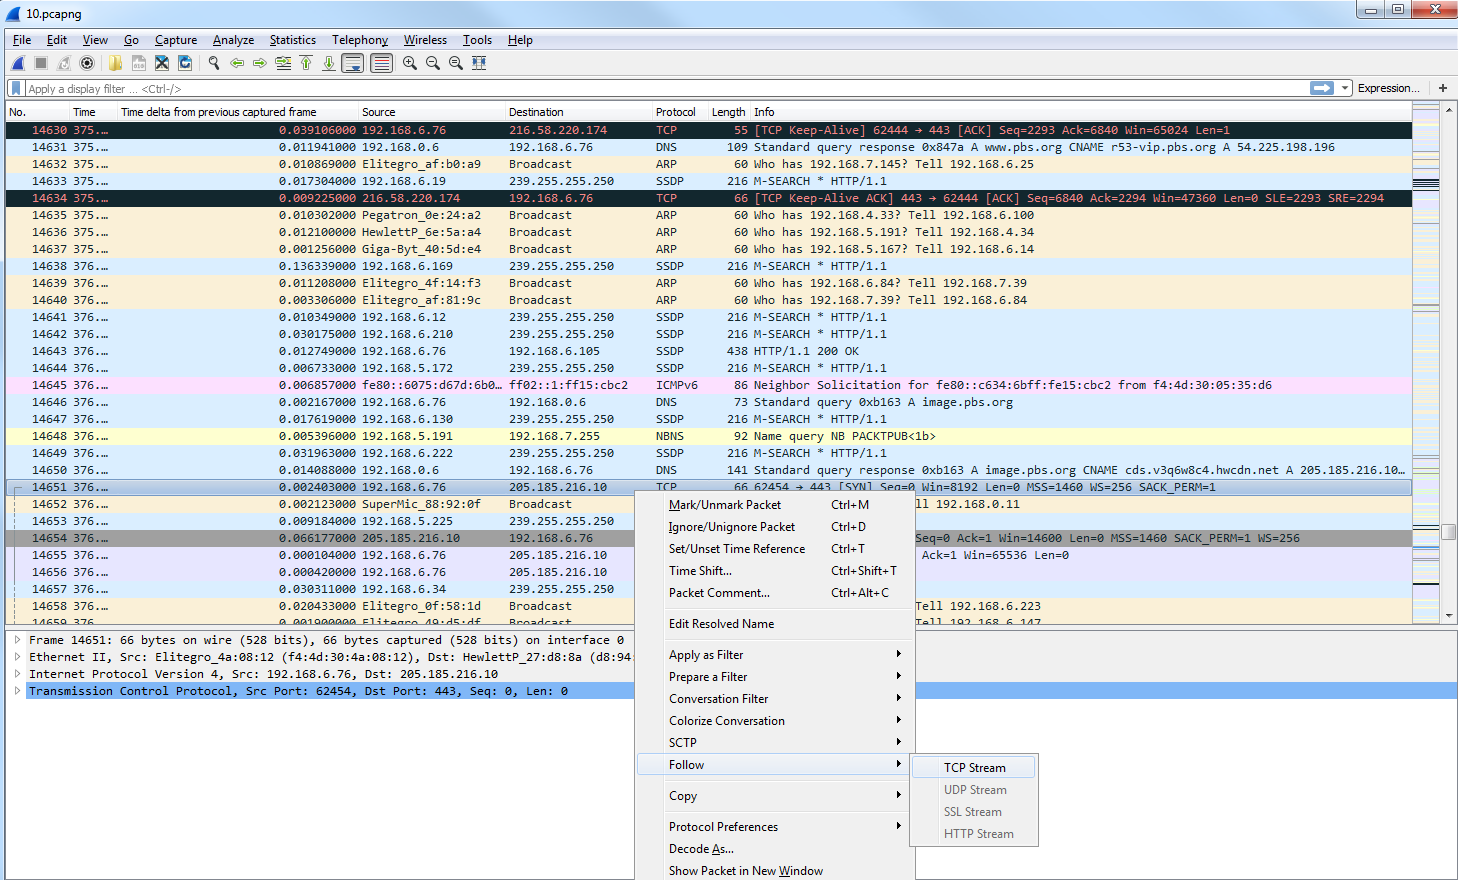
What we'll do is filter our traffic by this TCP flow. So we'll right-click on a TCP packet and go to Follow | TCP Stream:

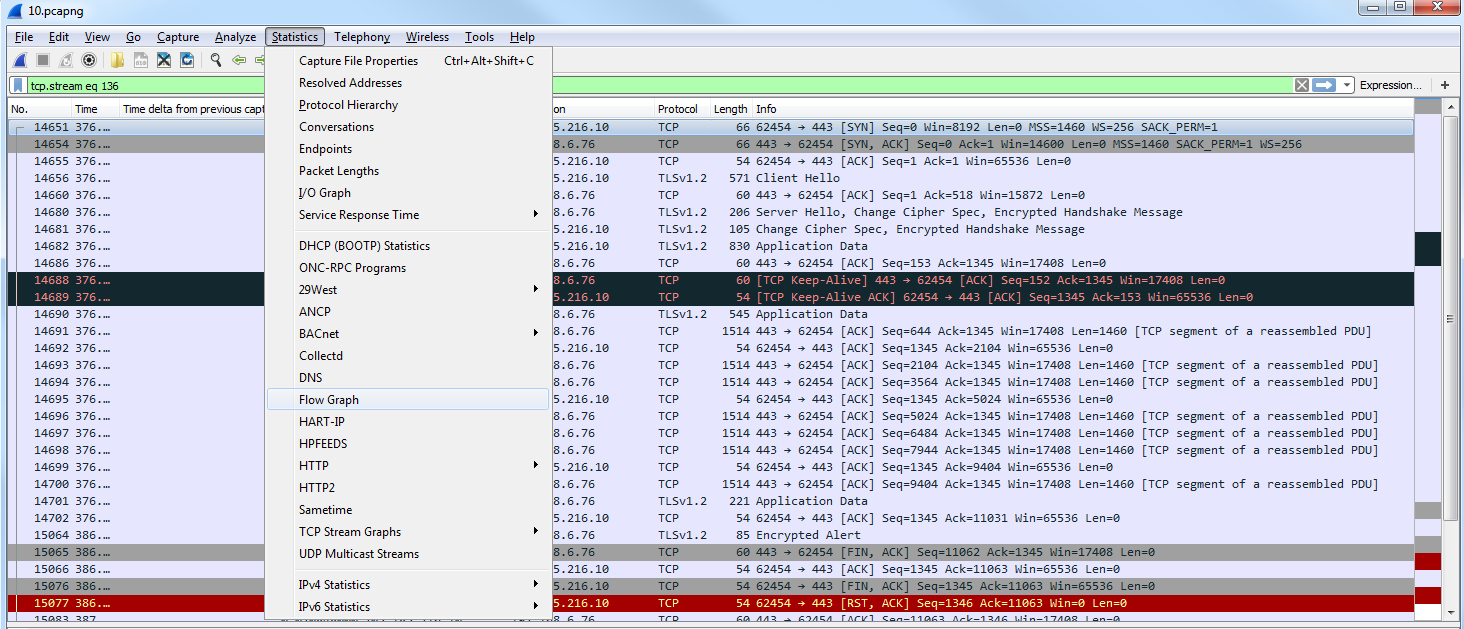
Now, we will create a filter for that. We've snipped out just a little bit of our traffic, and what we'll do next is go to Statistics and click on Flow Graph:

By default, it shows all of the packets in our packet capture:

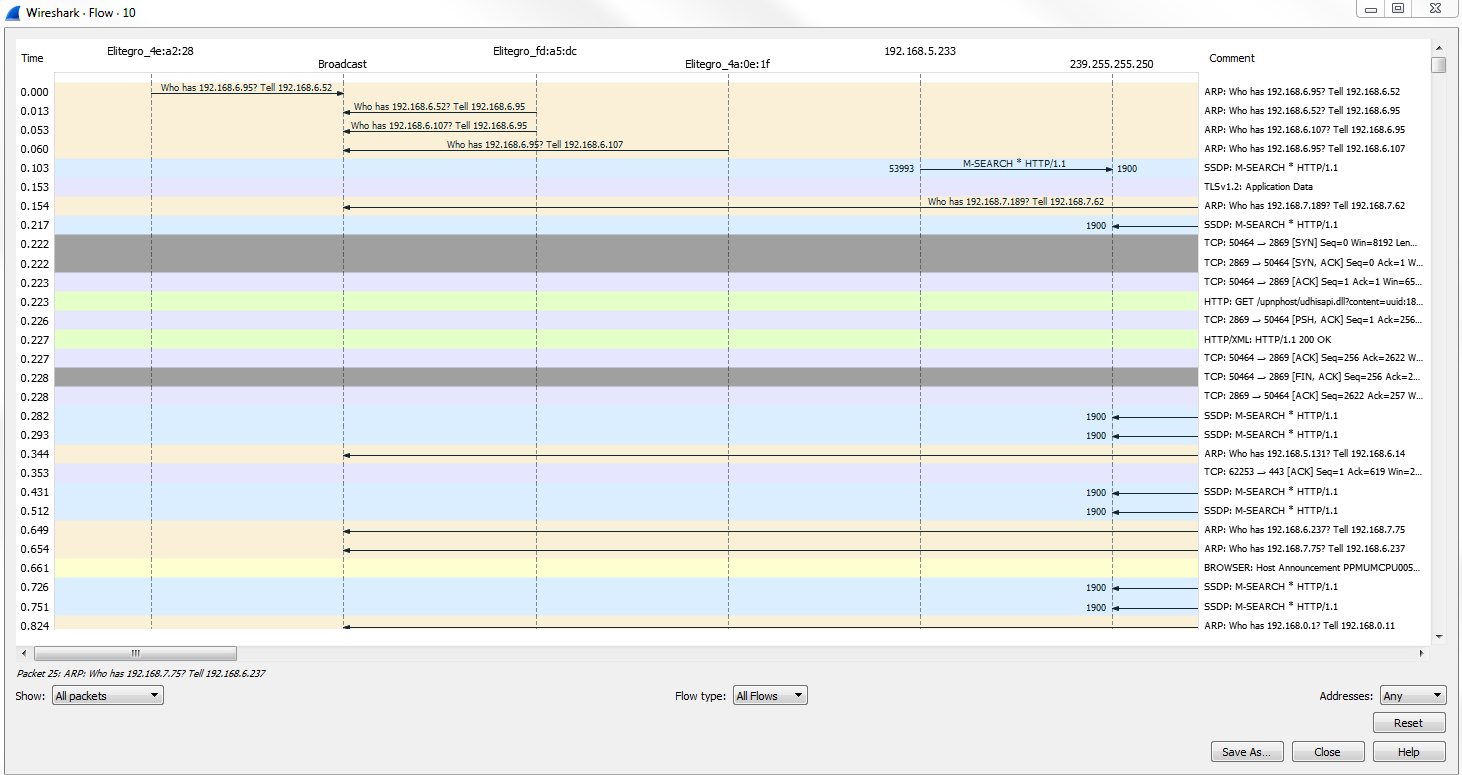
As we scroll through, you'll see all of the flows, all of the TCP handshakes-that is, the SYNSYN, ACK, and ACK-and all of the requests and responses. Everything is in here, in a nice graphical format that you can use to diagnose your traffic. This is very useful for SIP traffic, for example.

What we can do is make the change in the bottom left where it says Show, and select Displayed packets here:

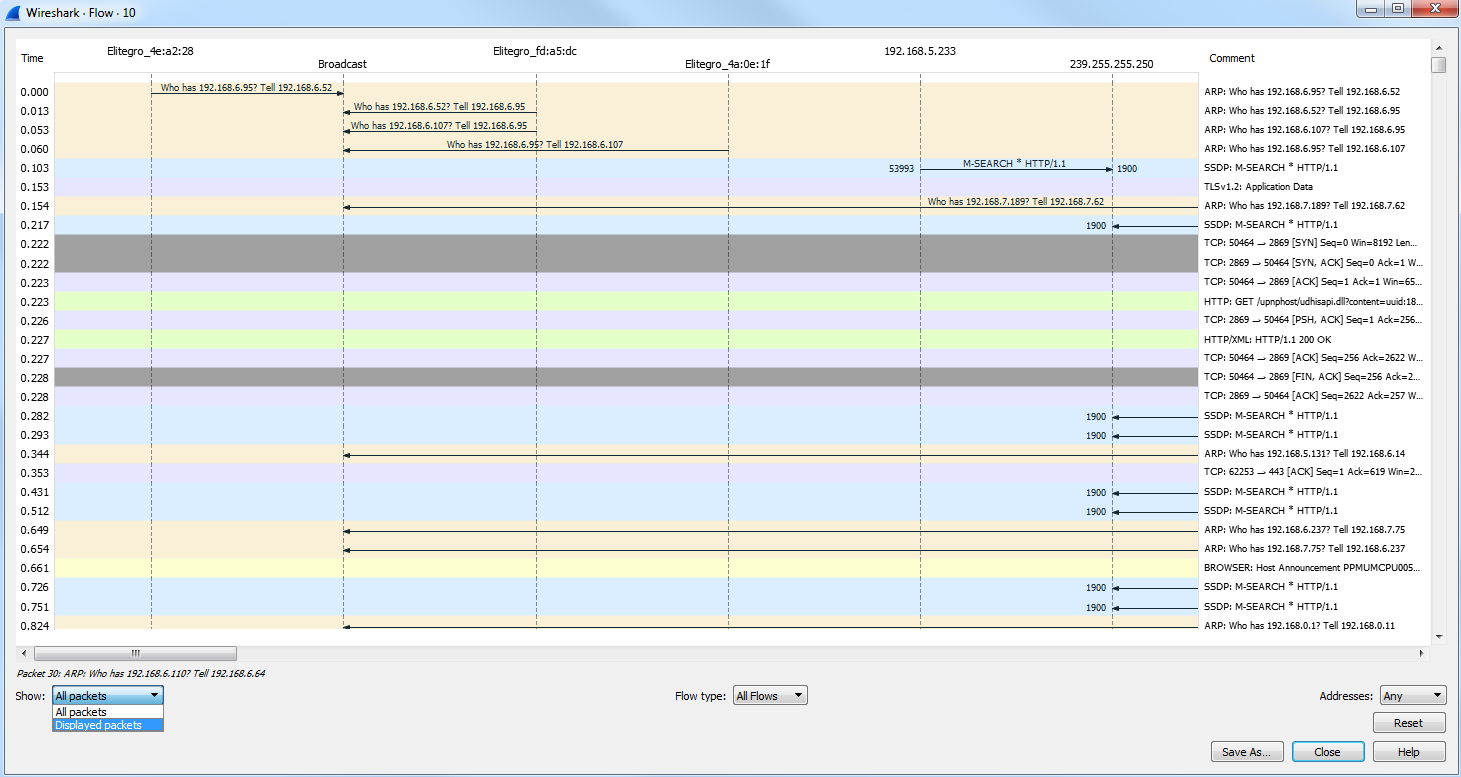
This change will be made for the filter that we have behind the screen. You can see the communication going from my computer to the server as I request for data such as a SYN:

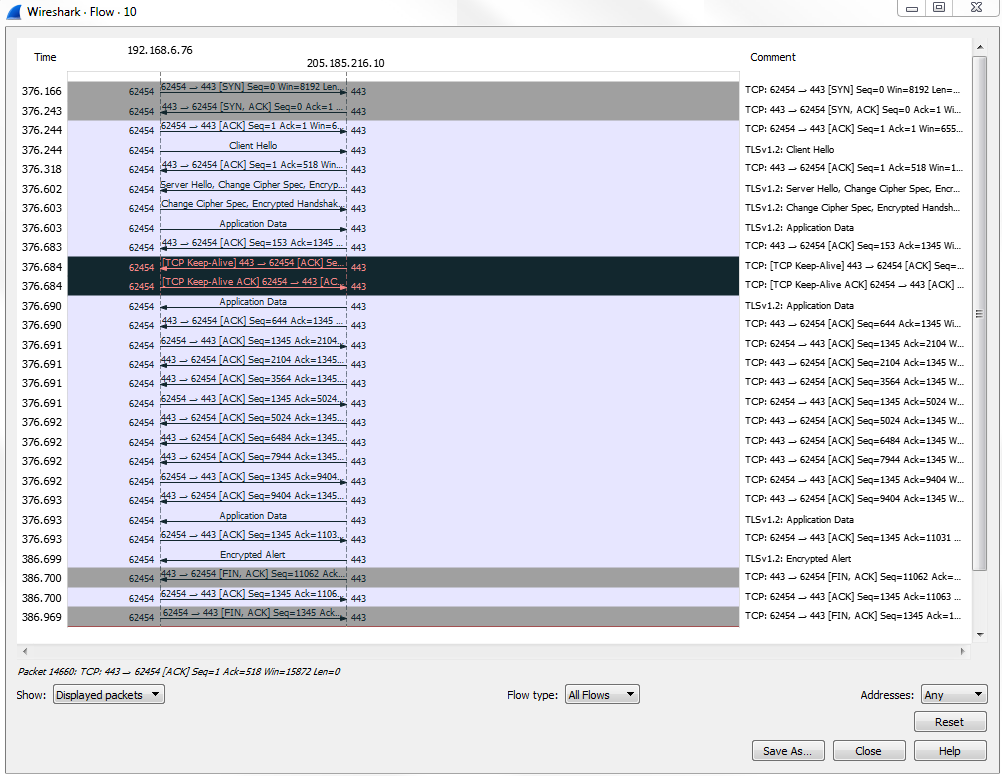
It's a very useful way of graphically representing the data flows that occur within your packet capture.