Table of Contents for
Mastering Wireshark 2

Version ebook / Retour

Cover image for bash Cookbook, 2nd Edition Mastering Wireshark 2 by Andrew Crouthamel Published by Packt Publishing, 2018
  1. Mastering Wireshark 2
  2. Title Page
  3. Copyright and Credits
  4. Mastering Wireshark 2
  5. Packt Upsell
  6. Why subscribe?
  7. PacktPub.com
  8. Contributor
  9. About the author
  10. Packt is searching for authors like you
  11. Table of Contents
  12. Preface
  13. Who this book is for
  14. What this book covers
  15. To get the most out of this book
  16. Download the color images
  17. Conventions used
  18. Get in touch
  19. Reviews
  20. Installing Wireshark 2
  21. Installation and setup
  22. Installing Wireshark on Windows
  23. Installing Wireshark on macOS
  24. Installing Wireshark on Linux
  25. Summary
  26. Getting Started with Wireshark
  27. What's new in Wireshark 2?
  28. Capturing traffic
  29. How to capture traffic
  30. Saving and exporting packets
  31. Annotating and printing packets
  32. Remote capture setup
  33. Prerequisites
  34. Remote capture usage
  35. Summary
  36. Filtering Traffic
  37. Berkeley Packet Filter (BPF) syntax
  38. Capturing filters
  39. Displaying filters
  40. Following streams
  41. Advanced filtering
  42. Summary
  43. Customizing Wireshark
  44. Preferences
  45. Appearance
  46. Layout
  47. Columns
  48. Fonts and colors
  49. Capture
  50. Filter buttons
  51. Name resolution
  52. Protocols
  53. Statistics
  54. Advanced
  55. Profiles
  56. Colorizing traffic
  57. Examples of colorizing traffic
  58. Example 1
  59. Example 2
  60. Summary
  61. Statistics
  62. TCP/IP overview
  63. Time values and summaries
  64. Trace file statistics
  65. Resolved addresses
  66. Protocol hierarchy
  67. Conversations
  68. Endpoints
  69. Packet lengths
  70. I/O graph
  71. Load distribution
  72. DNS statistics
  73. Flow graph
  74. Expert system usage
  75. Summary
  76. Introductory Analysis
  77. DNS analysis
  78. An example for DNS request failure
  79. ARP analysis
  80. An example for ARP request failure
  81. IPv4 and IPv6 analysis
  82. ICMP analysis
  83. Using traceroute
  84. Summary
  85. Network Protocol Analysis
  86. UDP analysis
  87. TCP analysis I
  88. TCP analysis II
  89. Graph I/O rates and TCP trends
  90. Throughput
  91. I/O graph
  92. Summary
  93. Application Protocol Analysis I
  94. DHCP analysis
  95. HTTP analysis I
  96. HTTP analysis II
  97. FTP analysis
  98. Summary
  99. Application Protocol Analysis II
  100. Email analysis
  101. POP and SMTP
  102. 802.11 analysis
  103. VoIP analysis
  104. VoIP playback
  105. Summary
  106. Command-Line Tools
  107. Running Wireshark from a command line
  108. Running tshark
  109. Running tcpdump
  110. Running dumpcap
  111. Summary
  112. A Troubleshooting Scenario
  113. Wireshark plugins
  114. Lua programming
  115. Determining where to capture
  116. Capturing scenario traffic
  117. Diagnosing scenario traffic
  118. Summary
  119. Other Books You May Enjoy
  120. Leave a review - let other readers know what you think

What's new in Wireshark 2?

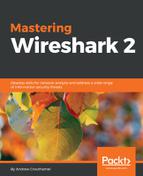
There's a new version of Wireshark out—a new major version that has many interesting features. Here, you can see the new Qt GUI:

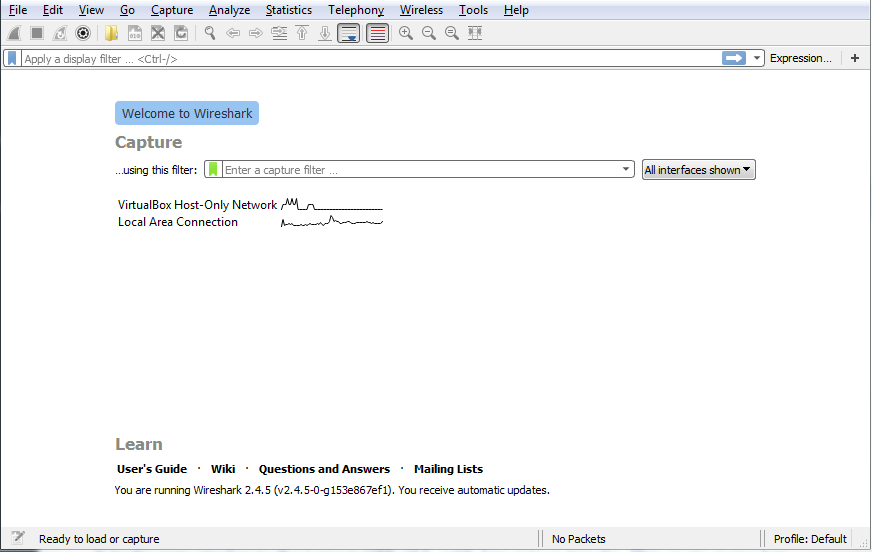
It looks very similar to the Legacy GTK GUI, with few minor tweaks. The main menu bar here has had some icons changed and removed; the general interface is a little bit cleaner. All the general functionality, though, is all the same. Capture options are on the upper left-hand side and they are denoted by a gear iconWhen you click on the gear icon, you have multiple tabs for Input options, Output options, and general Options:

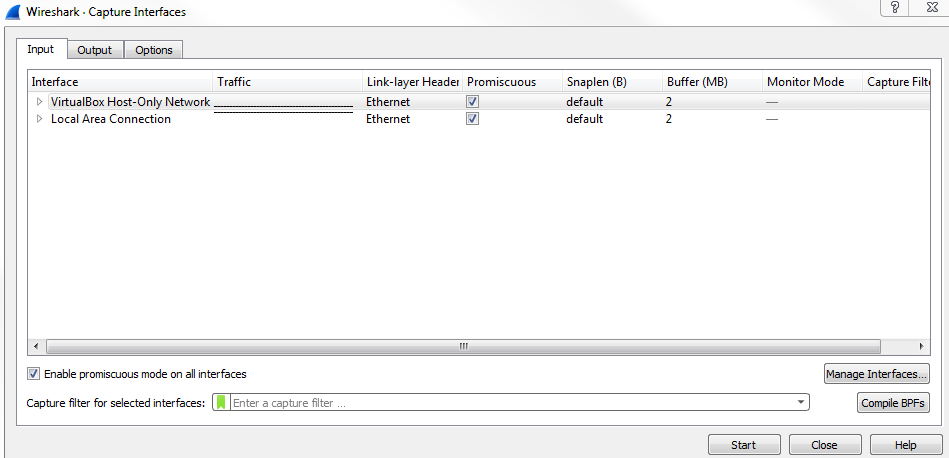
When you click on Edit | Preferences..., you can see the preferences window, as shown in the following screenshot. Options such as Show up to makes it easy to navigate and view what you need to see:

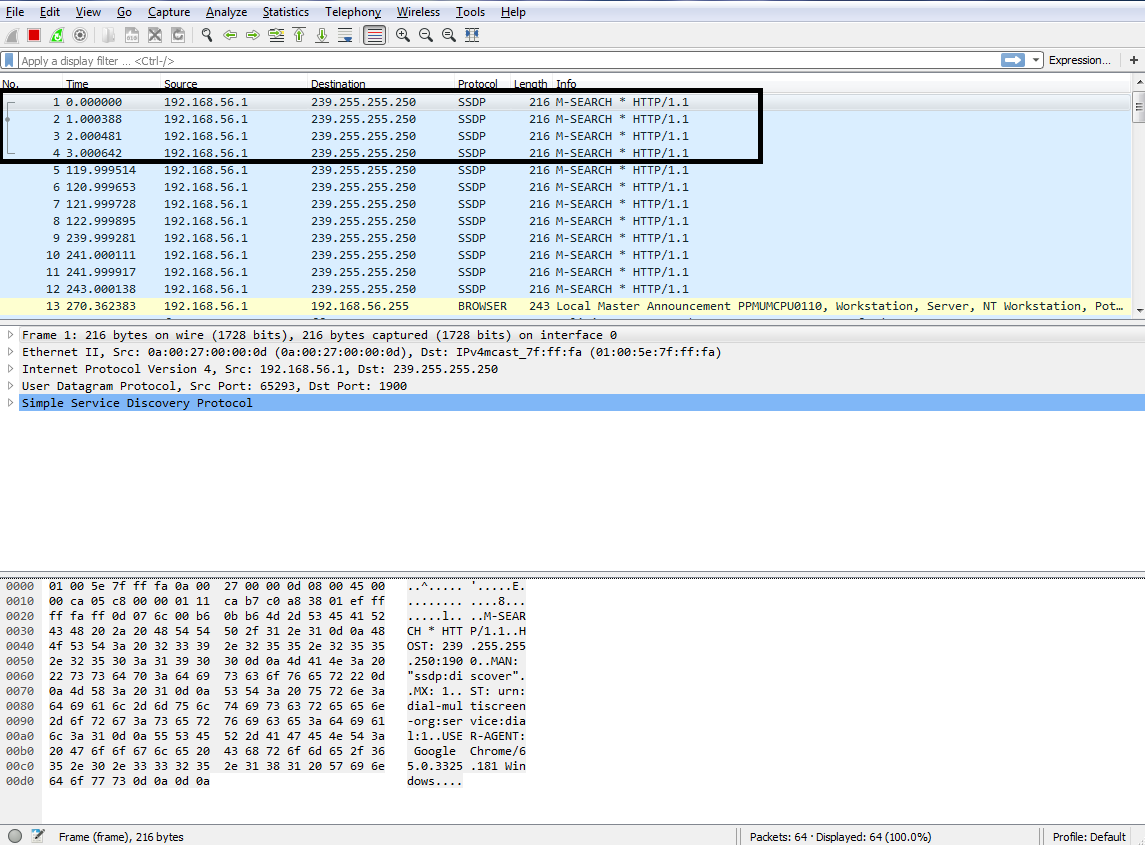
As shown in the following screenshot, on the left-hand side, you can see the related packets diagram show up, based on what you select. So if you select different packets, this will change in size and shape; and what might appear for you is then what you select. This makes it easy to pick out packets that are related to each other without having to follow TCP or UDP streams:

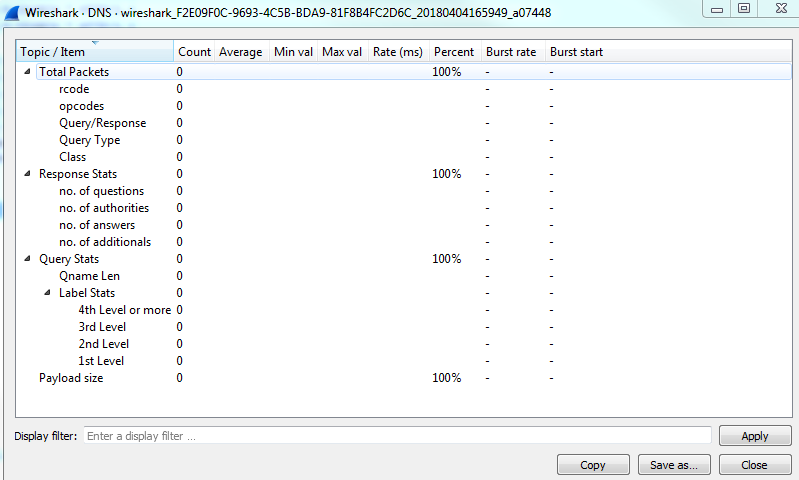
Under the Statistics menu that is present in the menu bar, many of these statistics options now have a similar-looking window, as shown in the following screenshot. If you look at how the buttons, filters, and general interface is set up, they're all now standardized and look very, very similar to each other, which I'm sure makes coding much easier for those who work on the Wireshark code:

Click on Statistics | I/O Graph; now you can see the Wireshark IO graph. In the bottom left-hand, you can click on the plus icon and add multiple items to the chart on your IO graph, and you can do this an unlimited number of times:

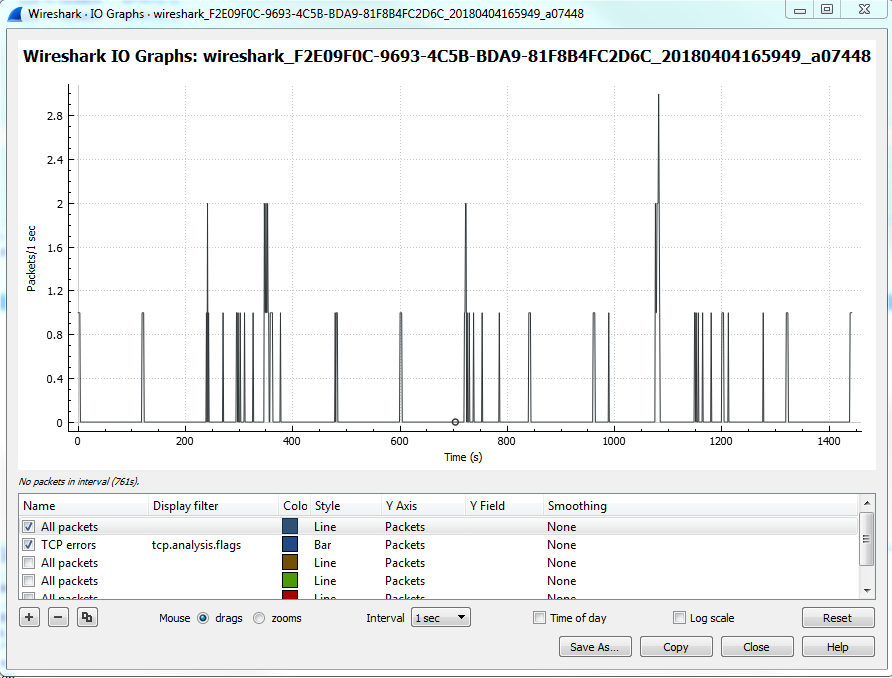
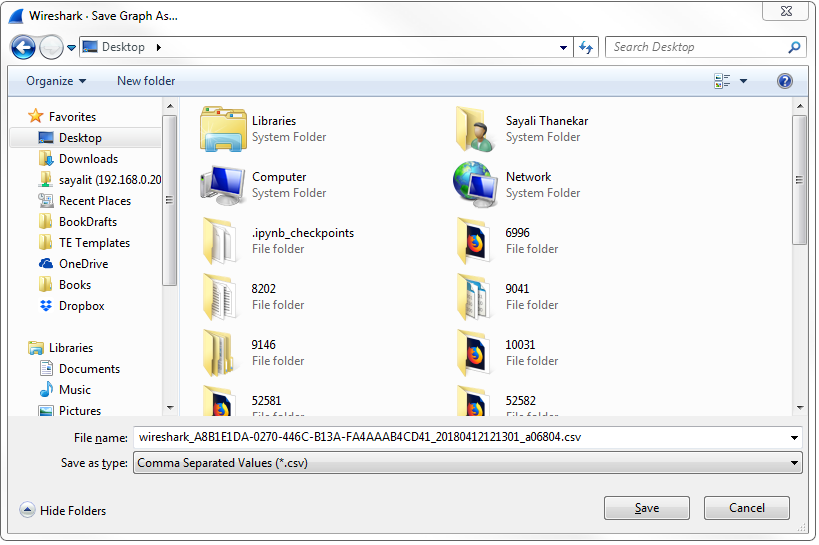
Additionally, any changes you make in here are saved to your profile. With this graph, you can also click on Save As... and select different file formats to choose from:

Click on Analyze | Follow | UDP Stream; you can see the follow stream dialog box has been updated so that it now allows you to select whether it's the entire conversation or just one side at a time. It also allows you to search for text within:

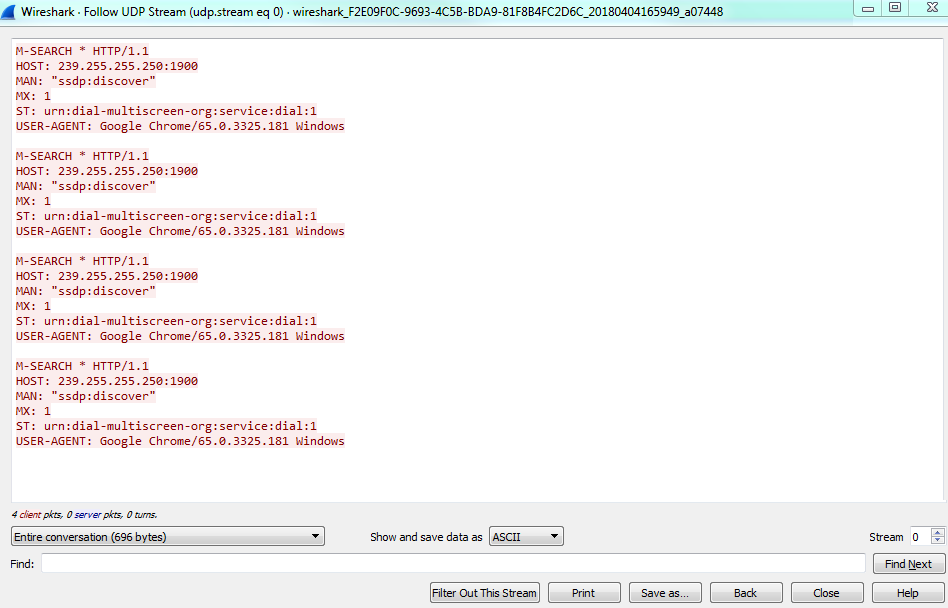
In the preceding screenshot you can see the context-aware hints in action. Within this stream, if you look at the bottom, you have some information such as client packets, server packets, and so on, that changes based on what you're hovering over. The main capture window will change to that actual packet.

This is very handy for jumping through the data and being able to see it in relation to the entire capture.

Let's now see how we'll capture traffic and get the first packets in that main window.