In this section, we will take a look at filtering on many different TCP header fields, and what kind of issues we could see based on some of the fields that we look at.
So, what we can see in the following screenshot is a packet capture of the websites that were opened:
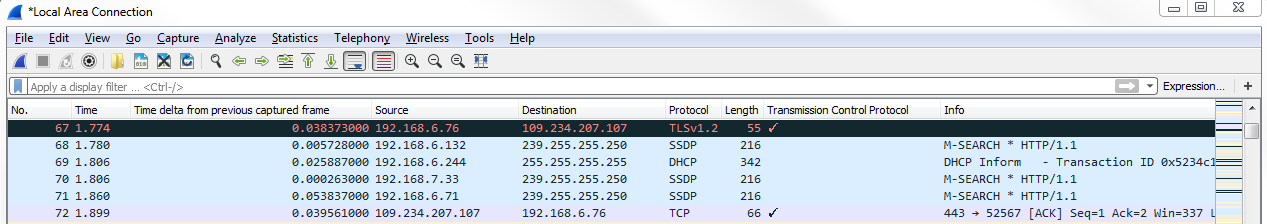
You can see we still have the TCP column enabled, so we can go down and find a TCP packet, and we'll see the field information again:
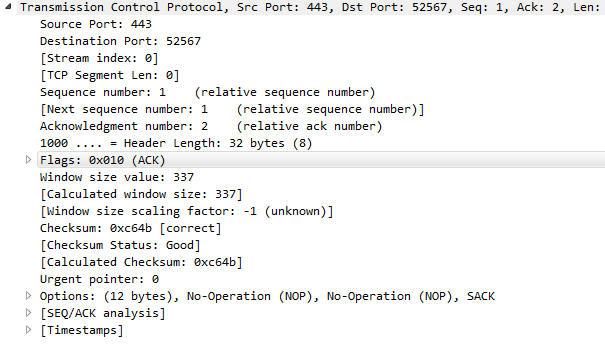
As with many of the other protocols that we've looked at, we can right-click on any of the fields and apply them as a filter. What we may want to do is expand the Flags, and look for anything that has the urgent bit set:
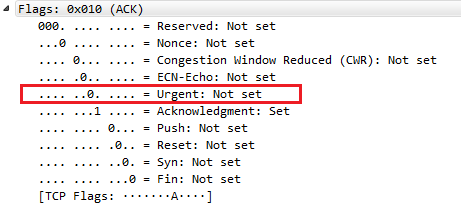
The urgent bit is not often used. The only one that we can think of is using Telnet, and what it does is it prioritizes the packets, basically. So what we can do is right-click on Urgent bit, and we'll go to Apply a Filter | Selected:
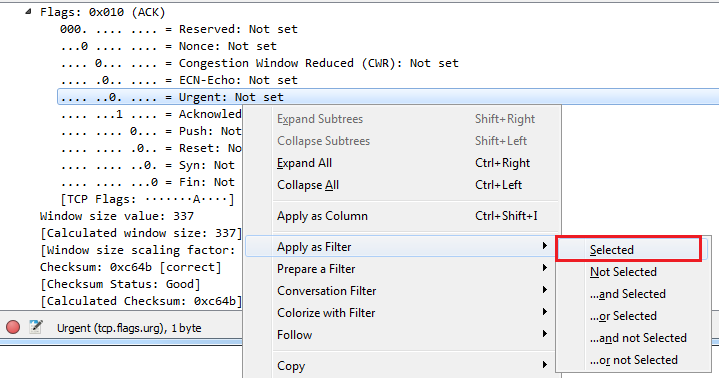
And we'll see that the filter's created, but it's based on 0. So we'll change it to 1:
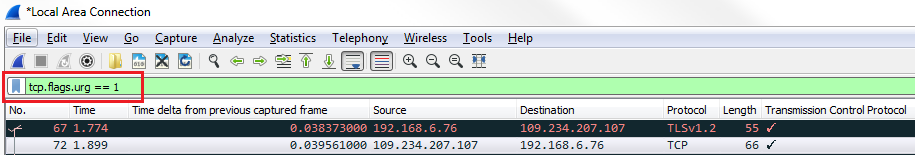
Now, we will see whether there are any packets that have the urgent bits set. We see that there are none, which is good. Another thing we can do is delete the filter back to tcp.flags, and if we press Enter on that, it now filters based on every single packet that has flags enabled:
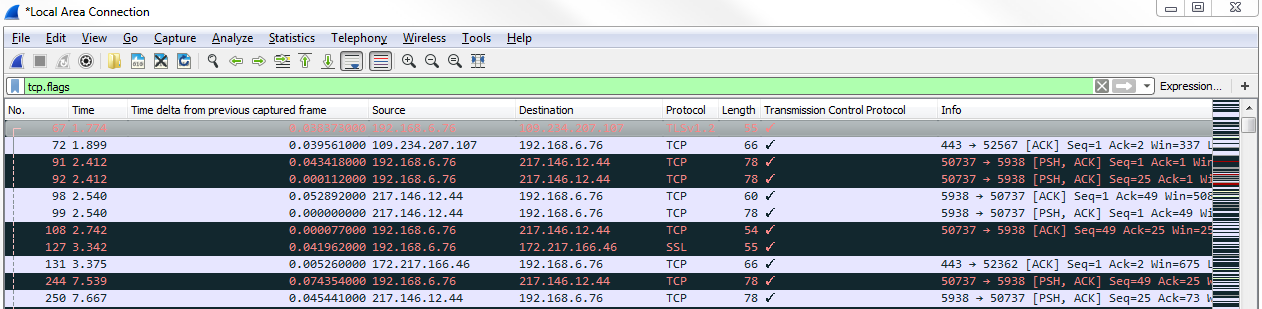
As you can see, we have a lot of packets that have flags enabled. So in this packet that capture may not be very useful. Depending on the type of traffic that you are seeing, that may be helpful to see what has flags and what doesn't. Here, it has too many packets that have flags to make that a useful filter. What we could do though is customize that and look for anything that has a reset. Usually, a reset is either at the end of a good connection, as explained, or it's indicative of a failure. What we'll do is we'll change our display filter so that it is tcp.flags.reset == 1:
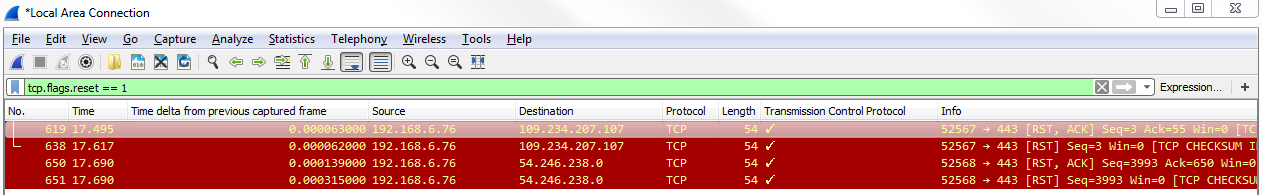
You can see we have quite a few packets that have resets. We can take a look at one of these, and look at the traffic surrounding the reset to see whether that's indicative of a problem. So, let's choose one packet and right-click on it and go to Follow | TCP Stream:
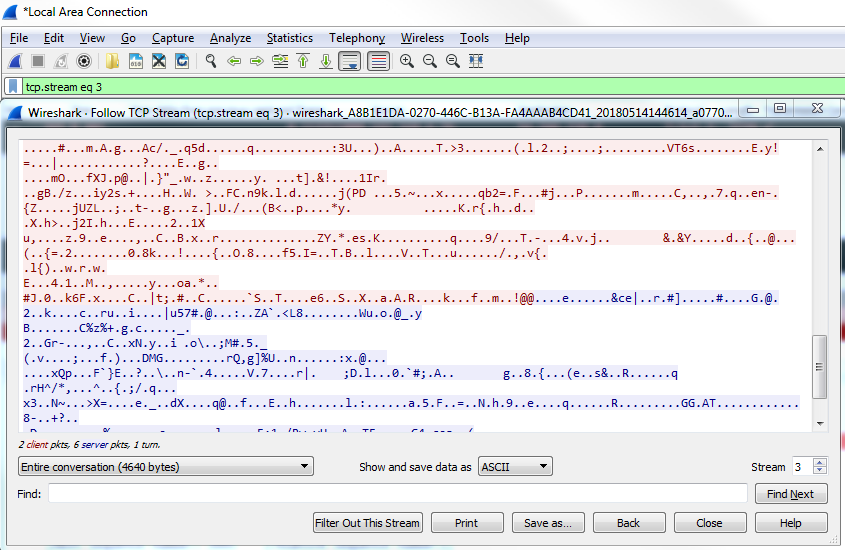
Close this, and we see it looks like some sort of a certificate transfer:
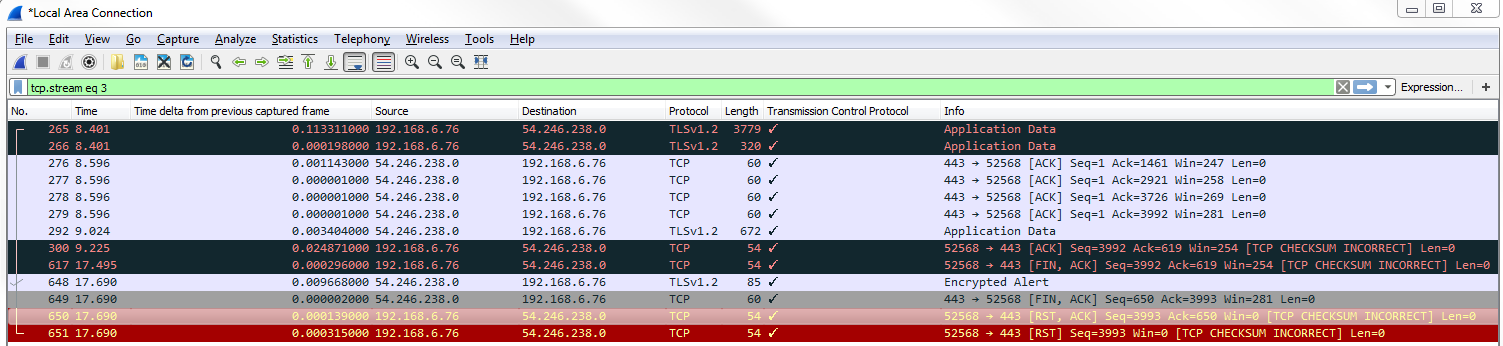
We have a three-way handshake; we have a client and server hello—it looks like it was a TLS negotiation. Then there are some packets of application data. Furthermore, the system sent a FIN, ACK, so we finalized the connection. That was an implicit termination, which was then followed up with an explicit termination, the reset. So this is actually fine. The system said: "I'm done with this connection, and then we'll reset and totally terminate this connection". So that's actually fine, but you can see how that's useful to be able to pull out everything that is a reset.
What we could also do is take a look at window size, and for that we will enter tcp.window_size < 50 and press Enter:
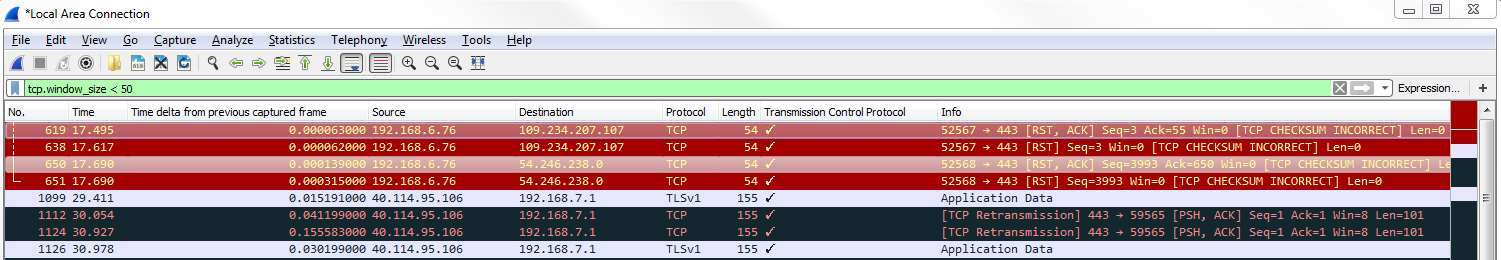
We see that we have quite a number of packets that have a window size of less than 50. Usually, a small window size is an indication of a problem. On a reset packet, it's not necessarily a problem because we're terminating a connection anyway, but if you see window sizes that are of a small value on standard data transfer packets, that's a problem. That's some sort of buffer problem in your linear devices in the network stack on, on one of the two. Additionally, Wireshark has some analysis filters that we can use, and we'll show one that is window size related. For that we will enter tcp.analysis.zero_window. If we press Enter on that, you'll see the following screenshot:
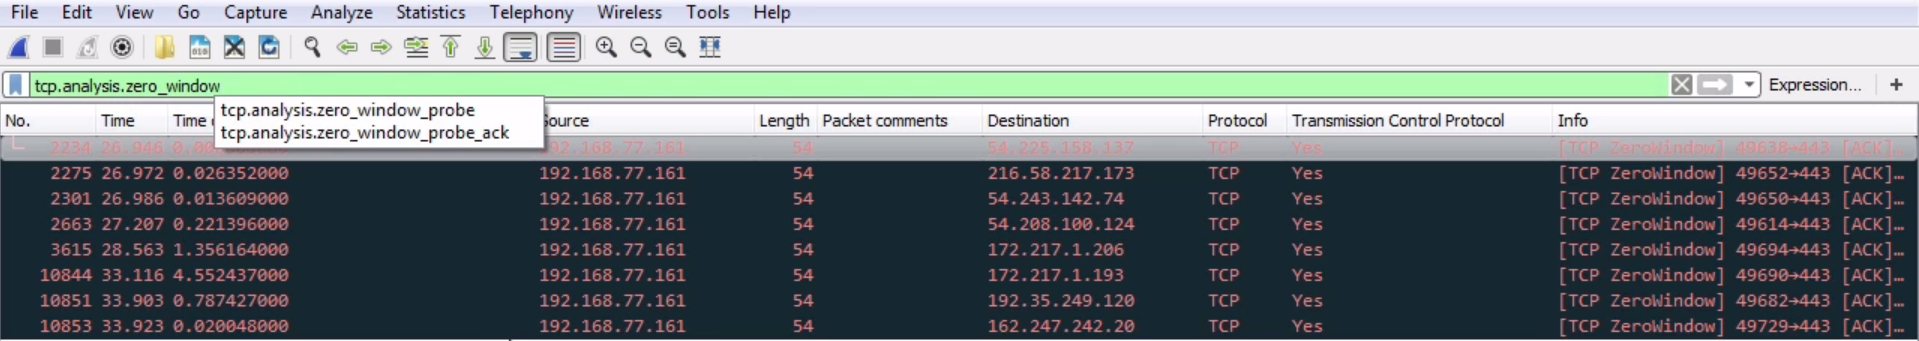
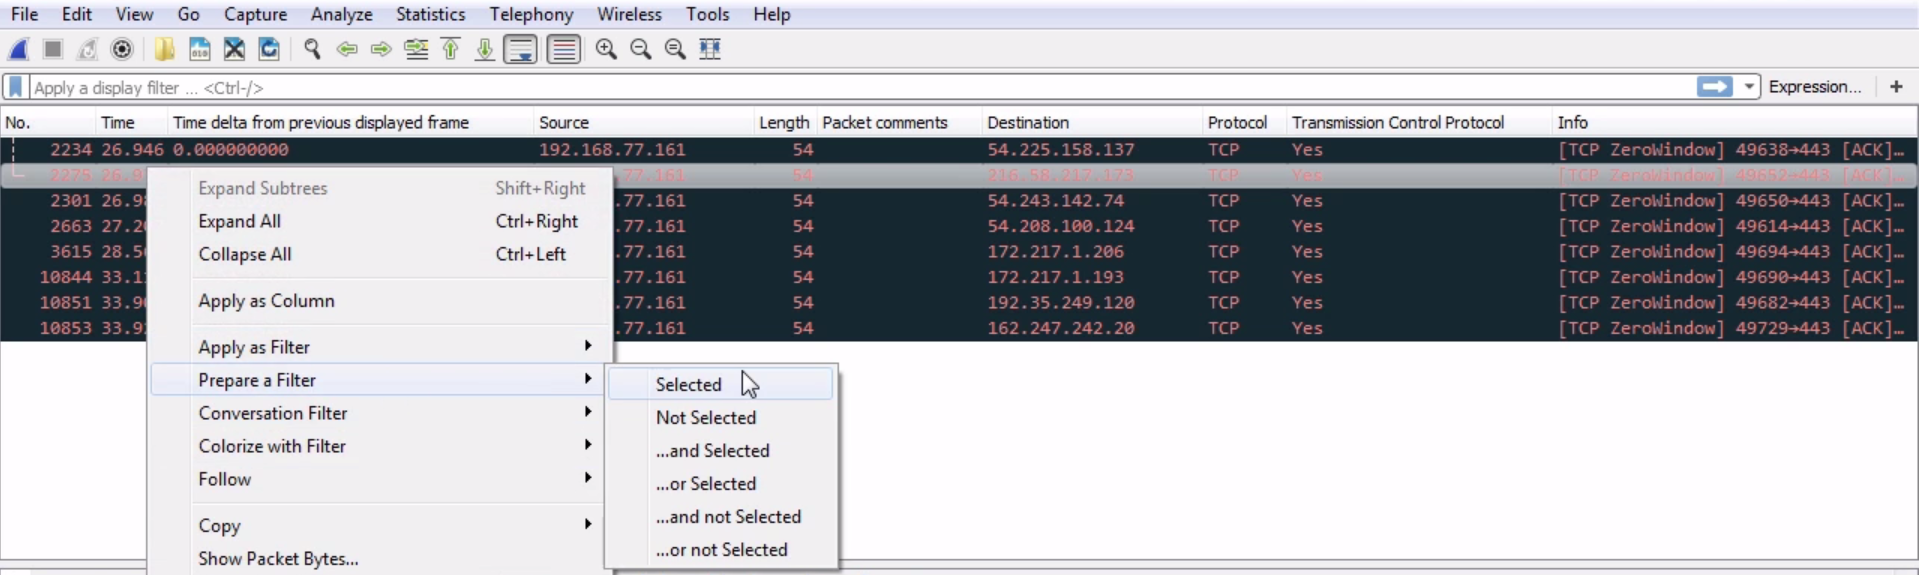
This is actually all of the packets that have a window size of 0, which is a problem. So these are potential issues. These are acknowledgments from the system to a variety of different servers out there, with the system declaring that it has no buffer space available. It's received buffer's full and it sends a zero window response back to the servers out there, saying: "please slow down". So this is a potential issue on the system.
Another interesting one that we could do is take a look at the header length. As you know, the TCP header can fluctuate in size, let's right-click on Header Length and go to Prepare a Filter | Selected:
We didn't use Apply as Filter here; that way, it doesn't apply it right away.
In the filter tab, we will enter tcp.hdr_len > 20, and here we go:
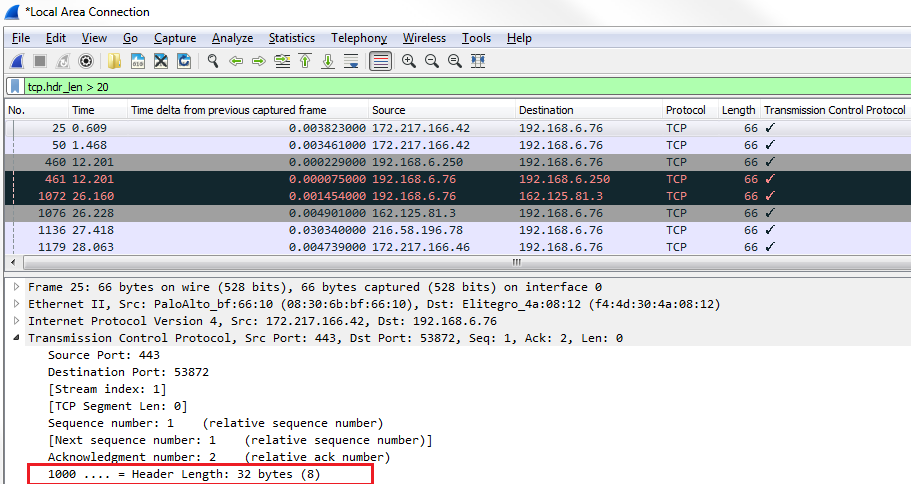
You can see that the first header length that pops up has 32 bytes. So, here's a good example of finding packets that have Options in them.
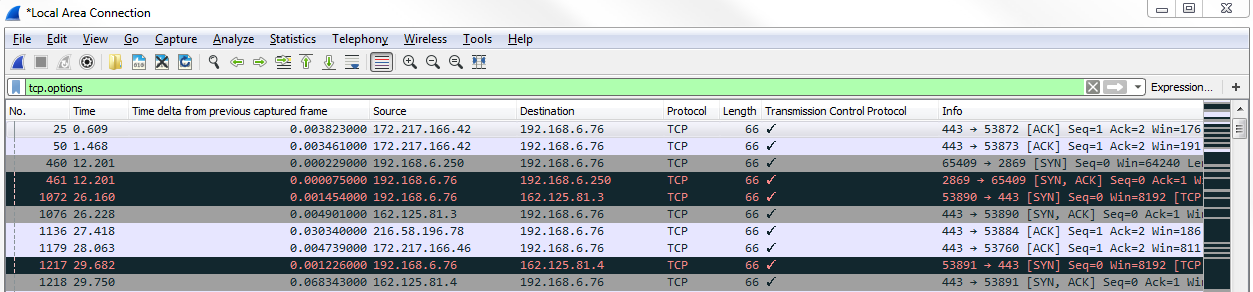
If we scroll down, we can see that the Header Length is larger than the standard 20 because it has Options built into it somewhere. Here, you can see this packet has Selective Acknowledgments and window scaling. You could also do a similar thing by filtering on Options, so right-click on Options and go to Prepare a Filter | Selected:
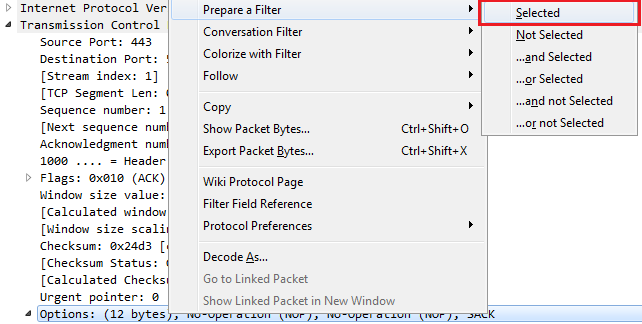
We prepare a filter and enter tcp.options. So here's every packet with options that are enabled within them: