
We'll take a look at how UDP works, what it is, and what's in the UDP header. The UDP protocol is a connectionless protocol and it's very lightweight—a very small header.
If you'd like to learn more about the UDP protocol, take a look at https://www.ietf.org/rfc/rfc768.txt:
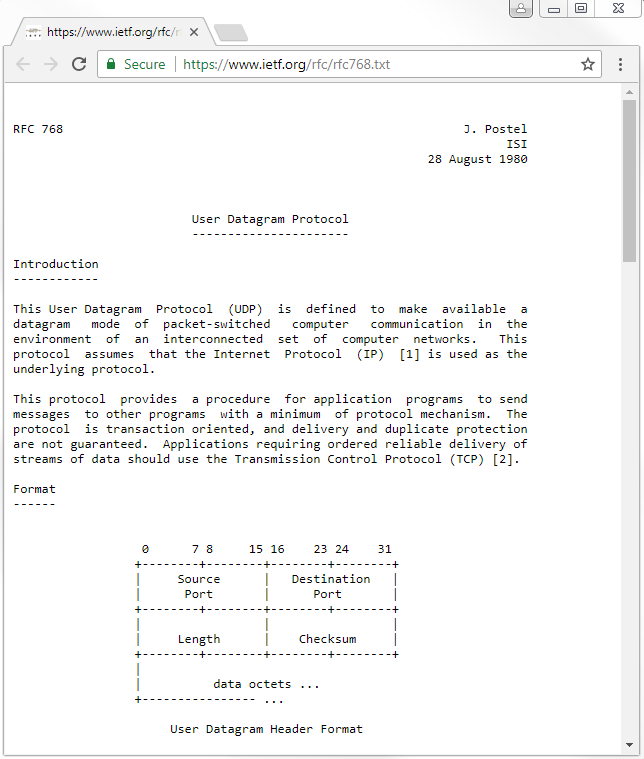
This is the original specification. It's been updated since August 28, 1980, if you look through all of the RFCs, but the original specification is 768. If you'd like to learn about all the details of UDP, which are relatively short, you can do so through the file shown in the preceding screenshot.
Let's take a look at UDP in Wireshark:
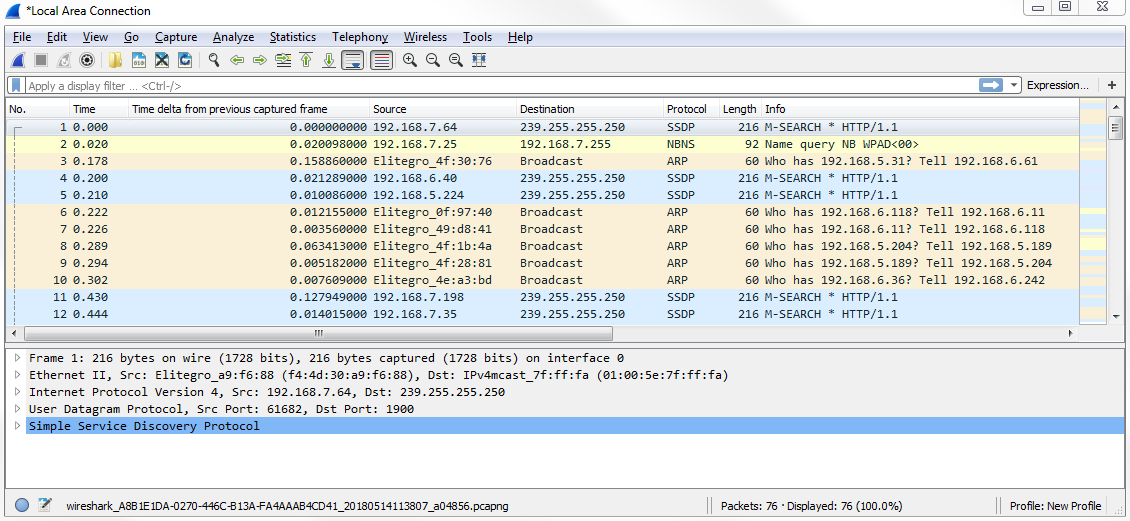
We have a capture of just a few seconds of data and a whole mixture of applications and protocols. What we can do is simply filter based on udp. If you press Enter, now it only shows UDP packets:
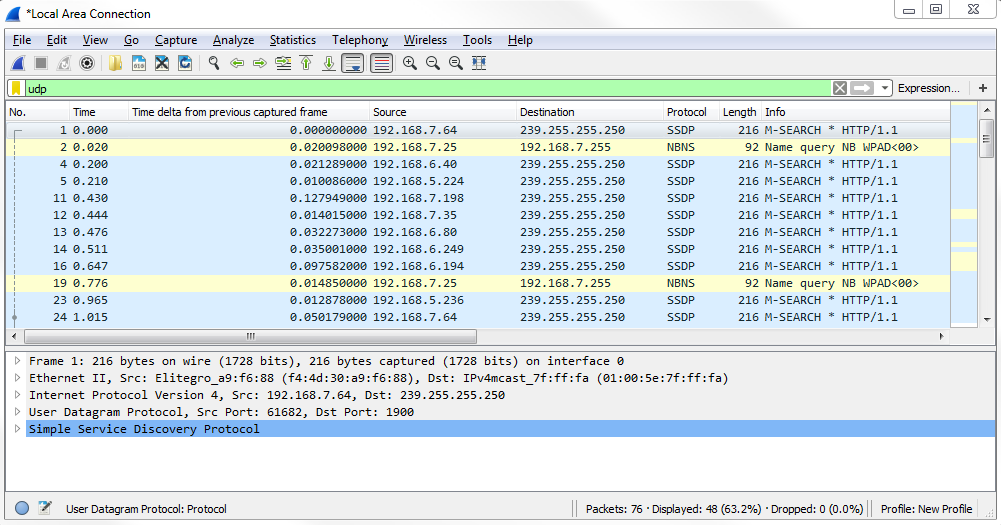
And you can see that we have some additional protocols listed, which include applications that use UDP for their transfer, such as SSDP. What we can do in the packet details is take a look at the UDP section:
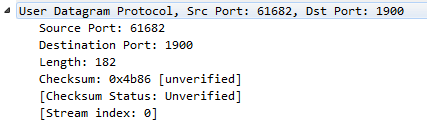
In the UDP header, there are very few fields. UDP always has 8 bytes in its header, and there are only four fields. We have a Source Port; a Destination Port; the Length, which is the total length of the packet, including header and data; and a Checksum, which validates the header information. But it does not encompass all of the data like you would expect, with the FCS in a frame, at the end of a frame. You can see that we have an unverified checksum. By default, this option is not enabled in Wireshark.
Now, go to Edit | Preferences... | Protocols | UDP and turn the Validate the UDP checksum if possible option on:
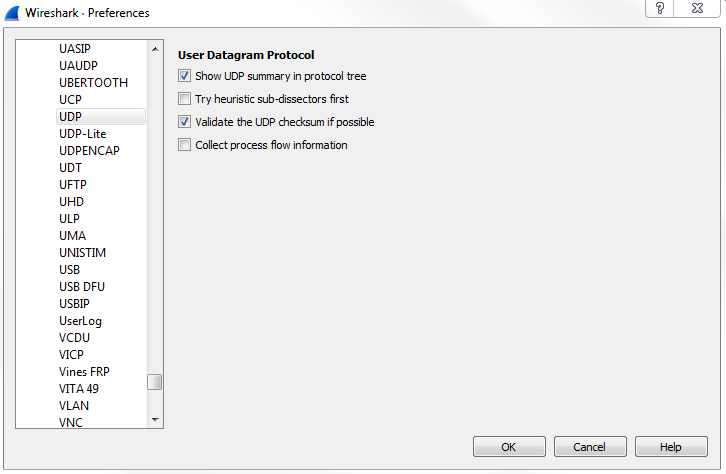
You can see that now the checksum says correct:
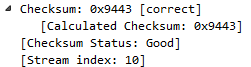
So, if there were any problems in the header and it was manipulated in transfer, we'll be able to see that here and it'll be marked. Then, if you expand Checksum, it'll tell you what is the checksum information that it was calculating.
There are usually very few problems that you'll have with a UDP transfer. Either they work or they don't. They do not guarantee any connectivity, and the applications will perform any sort of retransmission if necessary, built into the application. It's not handled within the stack like it is with TCP. Because it has a very small header and very few fields, there are very few options to be turned on and off. There's not much here; it's meant to be very simple and lightweight, which is great for voiceover IP or streaming video; anything like this, which is very time-sensitive. It sends the data on its way and hopes that it gets there. Great if it does; if it doesn't, then: oh well, you miss a packet or two.
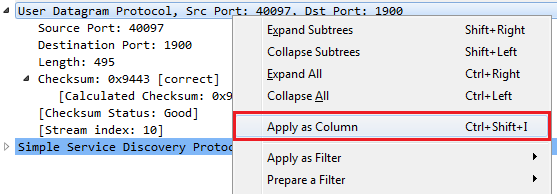
One thing you can do if you're not sure whether a packet is UDP or not when looking through the packet list up top is create a column based on UDP. So we right-click on User Datagram Protocol, Src Port: 40097, Dst Port: 1900 and select Apply as Column:
Now, we have a new column that says User Datagram Protocol; it is a UDP packet. If we remove our udp filter, we can see that we now have a tick mark and blank listed throughout our capture:
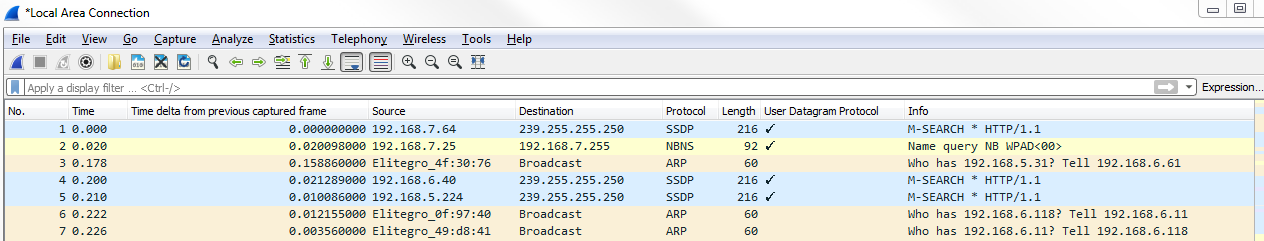
That's a nice way of easily seeing what is a UDP packet and what isn't, depending on whether or not you have different coloring rules or something like that that's in a large packet capture.
One of the few problems you may see with UDP are destination unreachable responses (these are ICMP packets, if you remember) following UDP connection attempts. If you have a UDP connection attempt and you continuously receive an ICMP destination unreachable in the next packet and also later on, that's an indication that you might have some sort of connectivity issue that you need to investigate. That's really the only sort of response you'll get because UDP does not send responses. The device itself may send a response telling you that a network is unavailable or something like that and hence the destination is unreachable. But, otherwise, UDP itself will not tell you anything. This is why there are very few things that you will see in a packet capture regarding UDP issues because there's nothing built into UDP to tell you that there are issues.