
In this section, we'll take a look at how to run Wireshark from a command line and explore some of the command-line options and how you might use them. The first thing I want to do is open up a Command Prompt, and then we'll browse where Wireshark is. Unless you have Wireshark in your system variable, you won't be able to simply type wireshark and have that function.
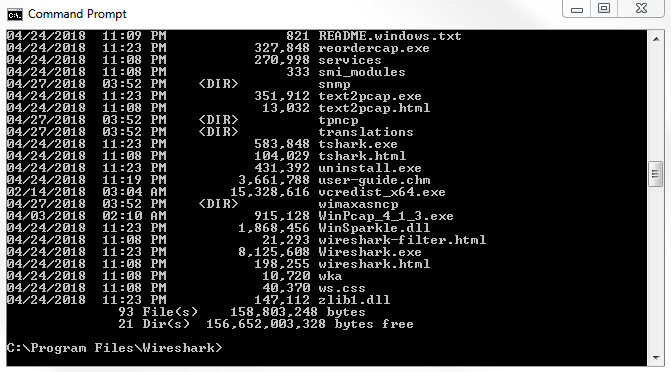
So what we'll have to do is go to its location. In my system, it's back in program files and in the wireshark directory. And if we type dir, we'll see Wireshark.exe, as well as some of the other tools that we'll talk about later, such as tshark:
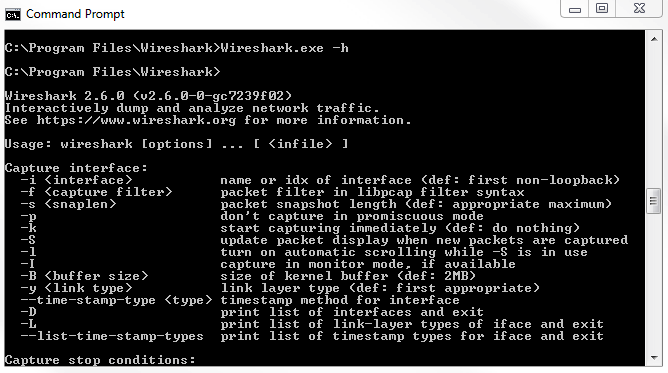
What we'll do is run Wireshark.exe; then, if you press Enter, it will open up Wireshark, just like if you were to click on the icon. If you type Wireshark.exe -h, it will provide the output of all the variables and arguments that Wireshark has available to it:
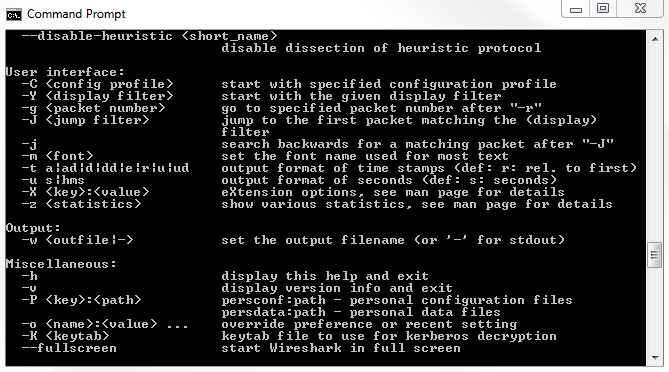
If we scroll up, we'll see the version of Wireshark we're running and a dump of all the variables and arguments that we can use:
You'll see that they're broken up into the following different categories:
- Capture interface
- Capture stop conditions
- Capture output
- Processing
- User interface
- Output
- Miscellaneous
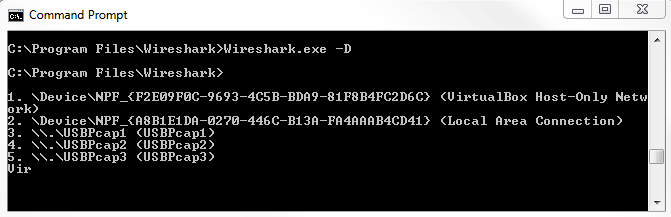
One of the first things you'll most likely want to do is set up Wireshark to run a capture with your default interface, your standard local area connection wired interface. You should see that you would do it with Wireshark -i and then the interface. It says the interface name or idx. Now, how do you determine what the interface name is or what idx is - what the index of what that interface is? This, you do with -D, which prints the list of interfaces and exits. Now, we will run Wireshark.exe -D.
We see that in the following screenshot, we have index numbers. That's idx: 1, 2, 3, 4, and 5. After the unique ID of that interface, we have the name, such as Local Area Connection, VirtualBox Host-Only Network, and other stuff that's on my system:
We can then execute Wireshark.exe -i and then either the name or the idx number. We will use the index number because it's nice and short and it prevents any additional typos. We'll type Wireshark.exe -i 1. Simply press Enter, and you'll see that it doesn't really do much. This is because we've opened up Wireshark, and by default, Wireshark opens up to the main home screen. The main home screen doesn't actually have to do anything yet at this point and so, it doesn't. You're not starting a capture; you're not doing anything. You just open it up. Now, you can see that it does have the first interface kind of selected, but it's not that useful. So, let's close this, and we'll tell Wireshark to start capturing the second it opens up, using the interface that we've defined. We can do that with -k, which says start capturing immediately (def: do nothing). It just opens up the Wireshark interface. We'll use -k. Type Wireshark.exe -i 1 -k, and it will immediately start capturing on that interface.
Another useful feature is to run Wireshark and have it automatically create files after a certain filesize or a certain duration of time, or after a certain number of bytes, or anything like that. Most commonly, people run Wireshark in a ring buffer, where you create a file and then it automatically switches to a new file every hour, every 30 minutes, or every 10 MB; whatever it might be that you have decided is the best way to approach this issue and to approach this system that you're capturing, based on the volume of data that you're expecting. What we can do is execute Wireshark using the flag to allow us to automatically create files. This is very useful if you want this to run overnight and not crash your system by having a 20 GB capture file in the morning: that'll not be very useful and it'd be very difficult to work with, if it is even possible at all, but it depends on your system. We'll run Wireshark with the primary interface that we've already selected, -i 1 -k, so it initiates the packet capture right away. Then, we'll define the fact that we're using a ring buffer. So, we'll use -b for ring buffer and the kind of ring buffer that we want. Do we want filesize? Do we want duration? What might it be? You'll see that ring buffer has a number of options such as duration, filesize, and the number of files that you want to replace them; hence the term ring, where they replace themselves in the circle. What we'll do is select -b for ring buffer, and we'll use filesize 10000.
If you do filesize 10000, generally the filesize is based on KB. We're saying that approximately 10 MB makes a new file, so every 10 MB we'll make a new capture file. We then have to define the output file. So, we're asking for a ring buffer, but we need to tell it where to put it. We'll say -w for write to (we'll write to an output file), and it'll be located in C:\Users\sayalit\capture.pcapng:
Wireshark.exe -i 1 -k -b filesize 10000 -w C:\Users\sayalit\capture.pcapng
If we run the preceding command, that will have Wireshark run and begin capturing all the packets. Once it hits 10 MB, it will then refresh the screen and start capturing again, and you'll see it just kind of flicker once every time it hits 10 MB and keeps coming up with a new screen as it captures a new cap file. If you go into the directory that was specified in the -w argument, you'll see all the files that were created every time it hits 10 MB. This was just an example of a few arguments and flags you can use when running Wireshark from the command line. As you saw, there are many options, and you can create very elaborate custom ones if you wish. Up next, we'll look at tshark, which is a command-line-only application that comes with Wireshark when it's installed.