
In this section, we'll take a look at how to run dumpcap, which is another alternative to tshark and tcpdump.
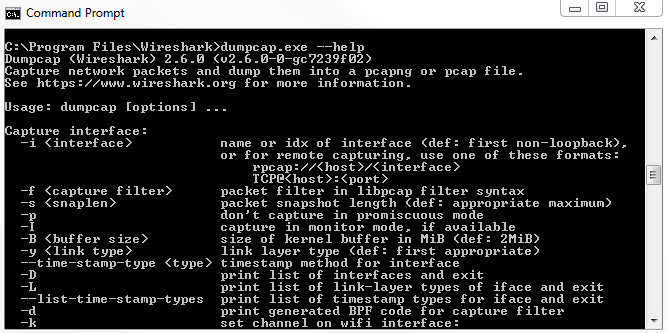
Once again, we'll have to go to dumpcap. In this example, it is installed with Wireshark on the system, and if we do a directory listing, you'll see that dumpcap is indeed listed. Tshark is actually based on dumpcap, and so we can type dumpcap.exe --help or -h. If we take a look at the output, it looks very similar to tshark and Wireshark:
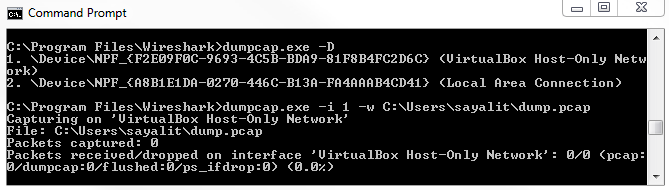
Depending on the system that you're using though, it may only have dumpcap available for one reason or another, or tshark may be using too much memory if it's a really small, embedded IoT system, or something like that. You could potentially use dumpcap to have an even lighter utility in order to capture traffic-or maybe you just like using this better. If we look at the arguments that are available, they are just like in tshark. We have -i, -D, and -w for output. They're all very much the same. We can illustrate that by running dumpcap, and we'll do -D to display our interfaces again. We can type dumpcap -i 1, and we'll output to a file again. We'll type C:\Users\sayalit\dump.pcap. If we start doing that, it'll begin capturing packets:
We can also expand this and define a buffer to use as well, just like the other examples, and we can do -b and say a duration of 60 seconds. This way, every minute, it will create a new file. We can also illustrate this by reducing the number of seconds. Let's change that to 5. Every 5 seconds, it'll create a new file for us. The filename is changing every 5 seconds. This is an example of using that buffer. Note that in all of these utilities, you can define filters that can restrict the capture, so you can apply capture filters to these. I would not recommend doing that unless you really have to. It's much better, if possible, to capture everything and then filter only what you need with the display filters in Wireshark. By applying capture filters, you can potentially miss some of the packets that might be useful. Maybe you're only capturing TCP traffic, but then a whole big blast of ARP or ICMP traffic ends up causing a problem. You would miss that because you're not capturing that traffic. If possible, you should just capture what you can with the defaults, use just a basic interface selection and maybe a ring buffer, and take the files and parse them out. Also, observe them in Wireshark. Just apply display filters and carry out the necessary actions such as graphing it.