
Let's take a look at how DNS works at a basic level and how to do common tasks with DNS such as look in a Wireshark capture.
We will start by flushing the DNS cache on the computer, which will clear out any of the cached entries on the device so that if we try to resolve any of them, it will have to go get a new resolution from the servers out there on the internet. For this, we will enter the following command:
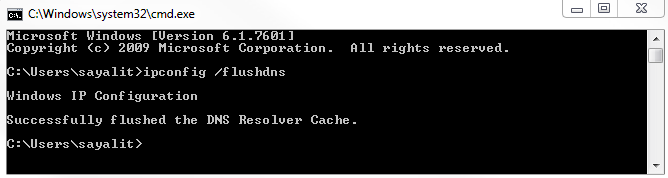
Since we've cleared that out, let's do a standard resolution.
Before we do a resolution, what DNS does is resolve domain names and different records of these domain names to IP addresses. That's its primary purpose.
DNS is used for all sorts of things, some of which are listed here:
- Browsing the internet in any fashion, such as with the web
- If you're trying to resolve FTP servers or game servers
- If you're trying to run an active directory on a domain 011 into a local network
- If you're trying to run VMware
All sorts of different services out there use DNS; there's a common mantra in IT that even when you think it's not DNS, it's usually DNS whenever there's a problem. Let's take a look at what a normal DNS resolution looks like.
For that we will type the following command in Command Prompt:
nslookup wireshark.org 8.8.8.8
We'll force that query to go out to Google directly. If I press Enter, we get the following output:
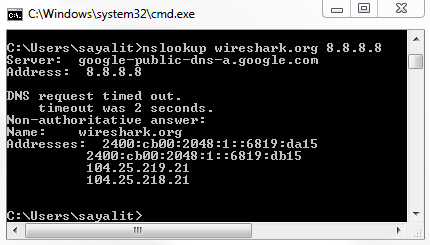
So, in this result, you see that we have the server that responded to our query, 8.8.8.8, and we can also see the DNS name for that server address. You can also see the answers that it has for that device for that server, and you can see that we have both IPv6 and IPv4 addresses.
The IPv6 addresses, as you can see, have a very different format from IPv4.
So what we want to do is take a look at this from a packet level. For this, we'll flush the DNS cache again:
ipconfig /flushdns
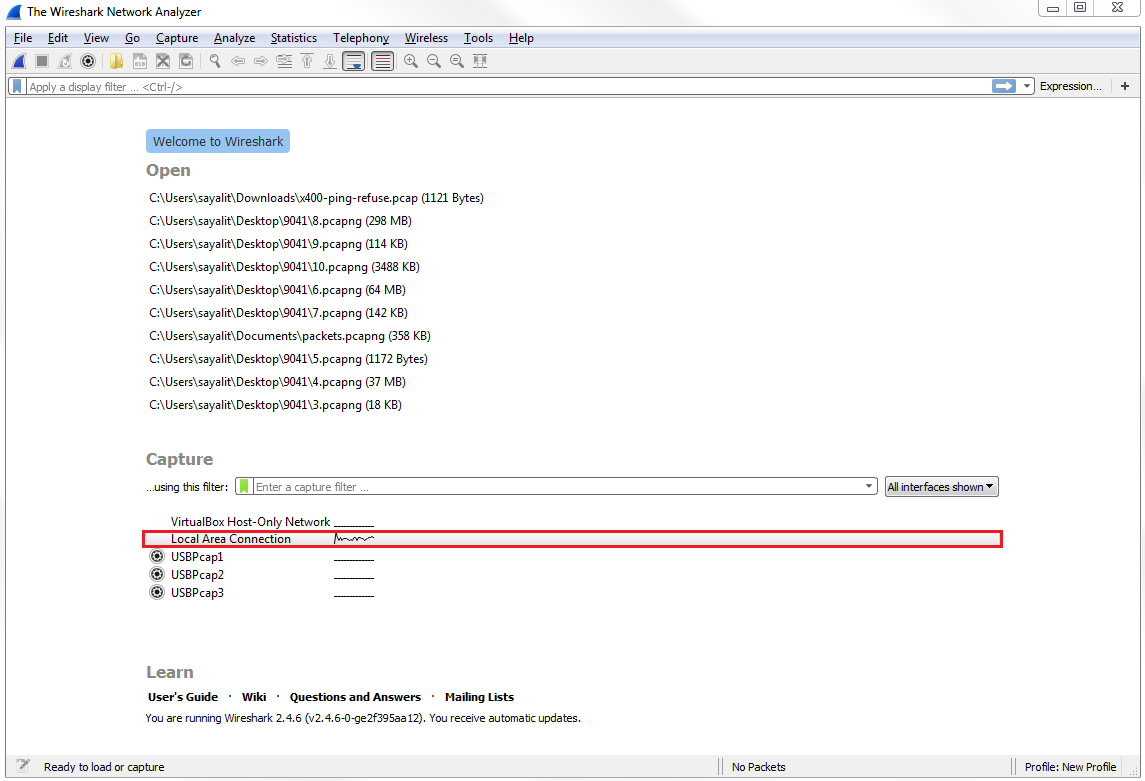
Next, we'll start a capture on the local interface, as shown in the following screenshot:
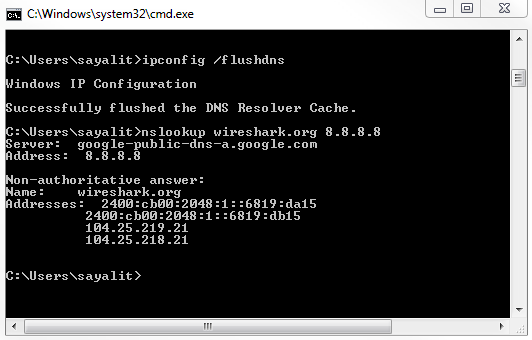
While the capture's running, let's go ahead and enter the same command we used earlier:
nslookup wireshark.org 8.8.8.8
Next, we will stop the capture. If you scroll down, you can see that there's a whole bunch of DNS as well as some other protocols. So what we'll do is, we'll use a filter and simply type in dns in the display filter. That will get rid of any other junk that we don't want to see:
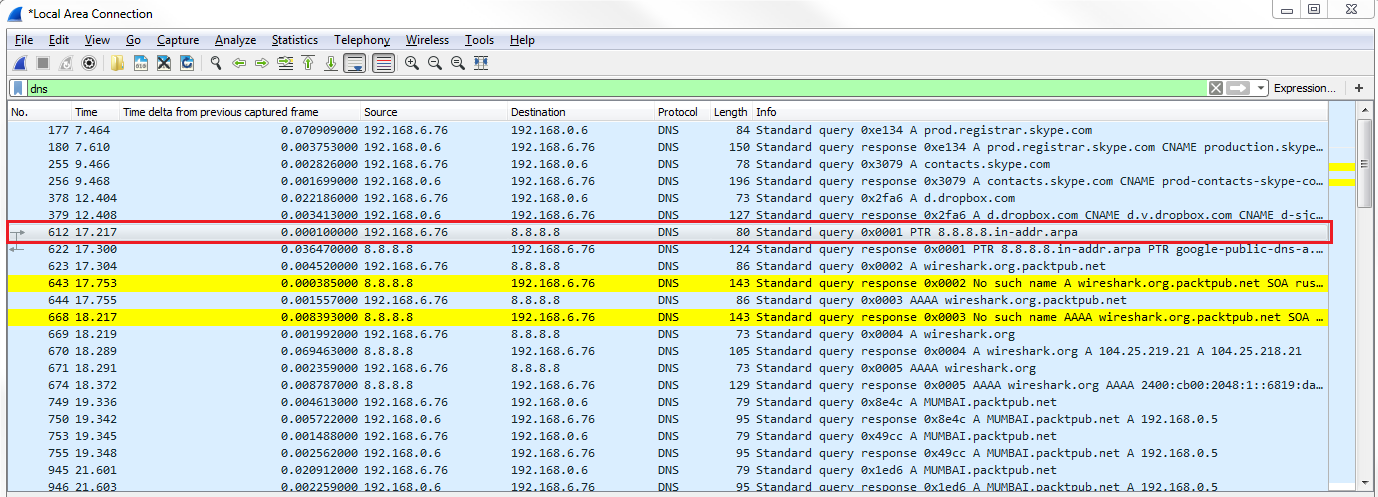
You can see the first request. So we have some other DNS requests that occurred by the system. We'll take a look at the first query highlighted in the preceding screenshot.
You can see in the query that it's asking for 8.8.8.8, and so it's actually asking for the domain name of the domain server. You can also see that it has a Transaction ID of 1.
If we look at the next query that happened, wireshark.org, you'll see that it has a Transaction ID of 2:
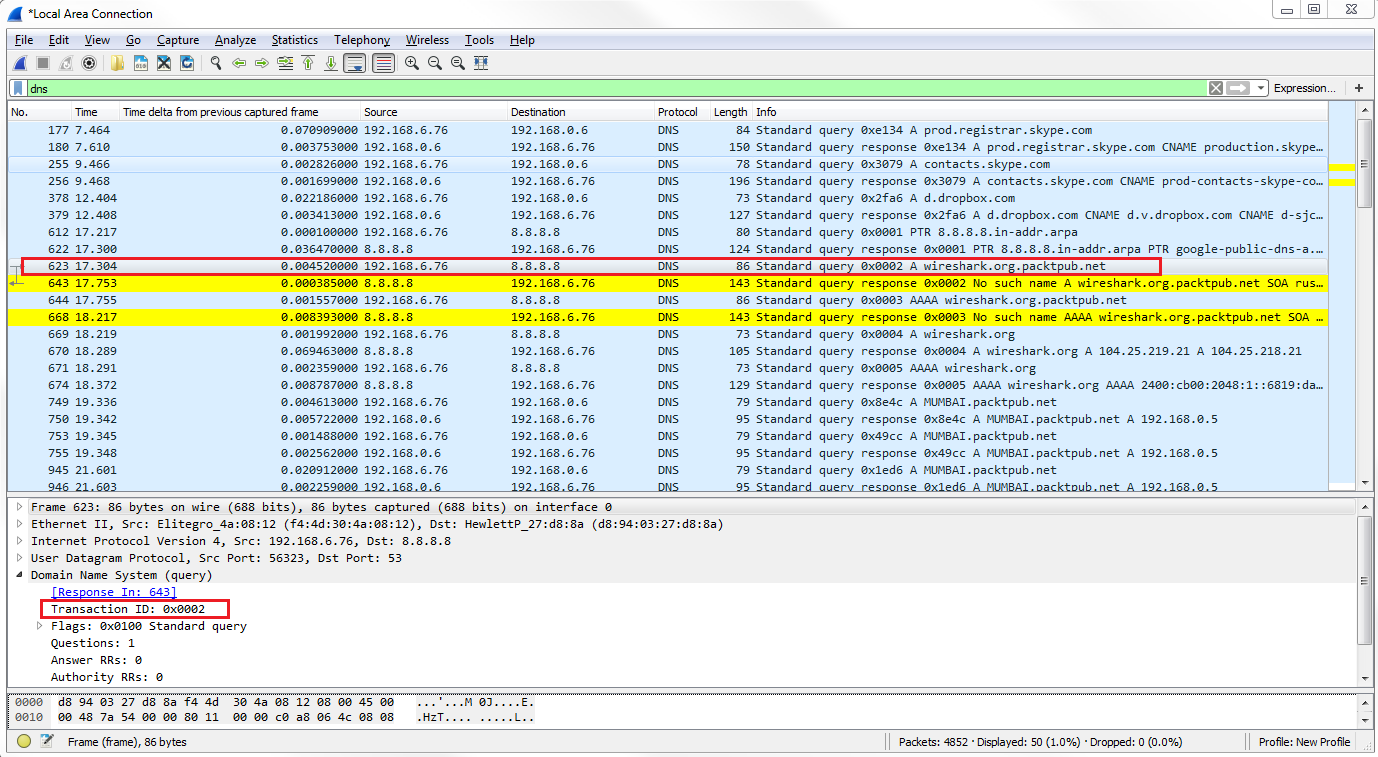
If we look at the packets in response to the query, they will have a matching transaction ID.
So a good example as to why this is useful is if you see a number of responses, or queries even, that are going around on your network and showing up in your packet capture with the same transaction ID over and over again, you may have a loop in your network; that could point to a problem with spanning tree, for example.
It's also just useful in general for us to be able to determine which packets are matched up from query to response. As you can see, Wireshark is automatically showing us the related packets between the two, as we've already mentioned in the previous sections.
We also have a line that tells us within the DNS section of the packet details that it's a response in packet 622:
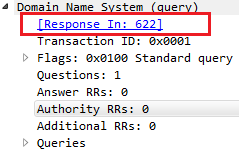
And if we double-click on Request In, it'll take us to the respective packet. Then, of course, you can go back and forth between the two. So, the transaction ID is very useful.
Let's go down to our second query for the actual wireshark.org, and open up the Flags. We can see that there's a flag turned on:
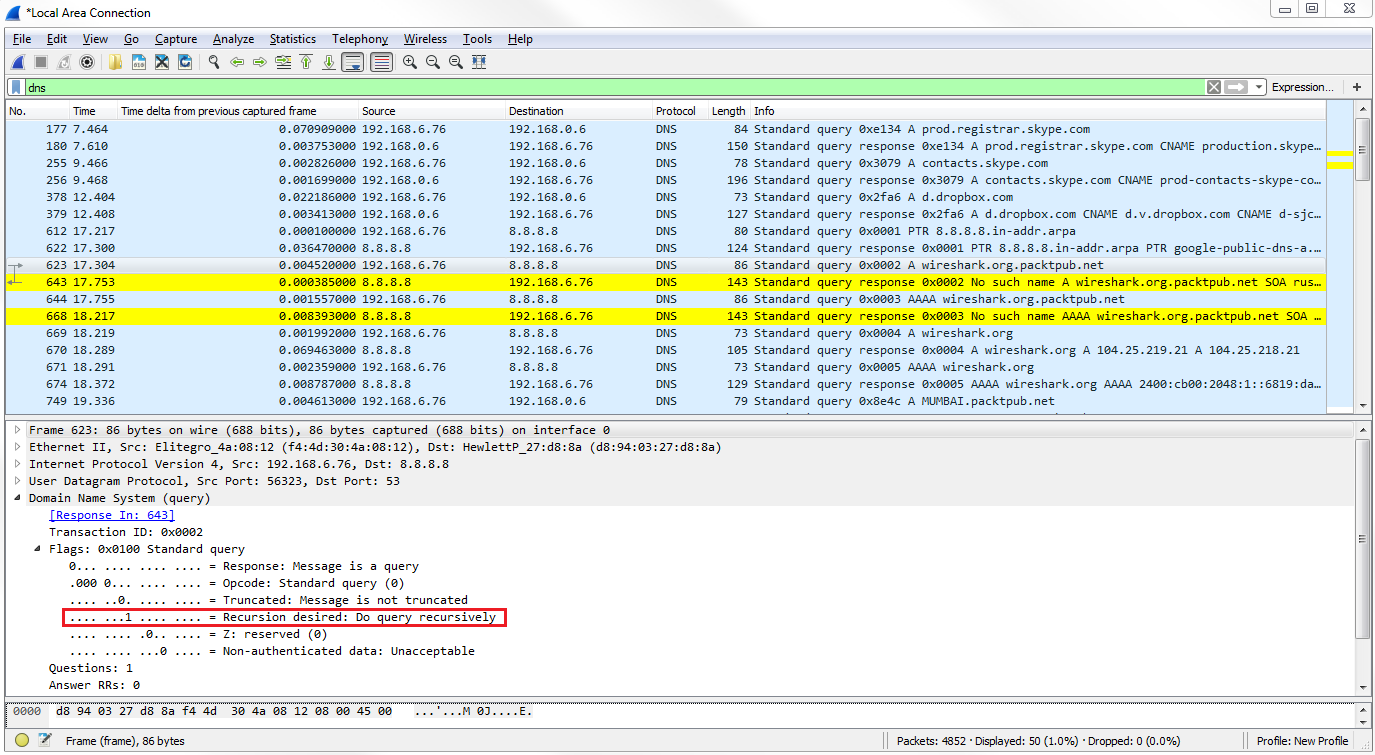
We have a 1 bit enabled, where it says Recursion desired: Do query recursively. This means that the query is requesting the server to ask other servers in case it does not have the answer to our query. A DNS server could have additional pointers configured in it, or additional forwarders set up on it, to go look for the answer to a DNS query. So, this query flag is saying "yes, go ahead and do that for us".
Let's go down to packet 669, where the system requests the wireshark.org A record from Google. We can see the response on packet 670. Then, we dig into the Flags, which gives the highlighted response in the following screenshot:
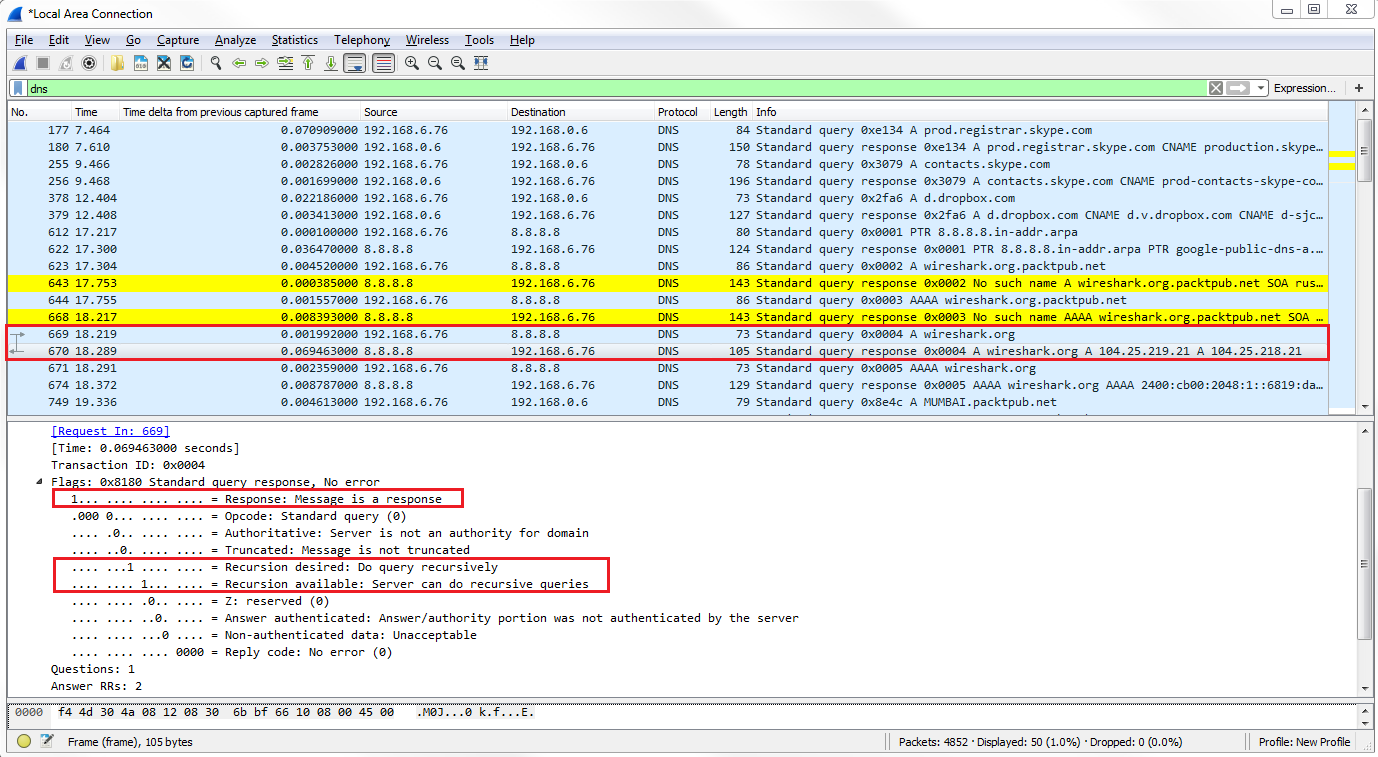
Bit 1 is enabled, so the highlighted part is a response message. It has Recursion desired and Recursion available as enabled.
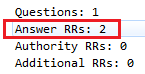
Now, we'll scroll down and see that we have Answer RRs: 2, so we have two responses to this:
We'll see the Queries and when we go down to Answers, we'll see that we have two records for wireshark.org:
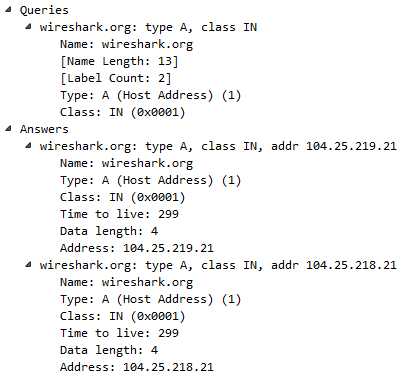
Thus, it looks like wireshark.org is using some sort of load-balancing system because we have an A record of 104.25.219.21 and 104.25.218.21. If you go to https://www.wireshark.org/, it will take you to either of these two addresses. You'll also see that there's a Time to live value, where you have a TTL of 299, which is the number of seconds that this record is to be kept on my system before it requests a new record. The TTL value is very short here, and most likely this is something to do with the fact that they are using a load balancer. If there's any sort of change in the address, it wants us to get an update as quickly as possible. It doesn't want us to keep a cached version of bad IP addresses for a very long period of time. For example, many defaults are 8 hours or 24 hours; so, converted to seconds, you might see 86,400 seconds or so.