Table of Contents for
Mastering Wireshark 2

Version ebook / Retour

Cover image for bash Cookbook, 2nd Edition Mastering Wireshark 2 by Andrew Crouthamel Published by Packt Publishing, 2018
  1. Mastering Wireshark 2
  2. Title Page
  3. Copyright and Credits
  4. Mastering Wireshark 2
  5. Packt Upsell
  6. Why subscribe?
  7. PacktPub.com
  8. Contributor
  9. About the author
  10. Packt is searching for authors like you
  11. Table of Contents
  12. Preface
  13. Who this book is for
  14. What this book covers
  15. To get the most out of this book
  16. Download the color images
  17. Conventions used
  18. Get in touch
  19. Reviews
  20. Installing Wireshark 2
  21. Installation and setup
  22. Installing Wireshark on Windows
  23. Installing Wireshark on macOS
  24. Installing Wireshark on Linux
  25. Summary
  26. Getting Started with Wireshark
  27. What's new in Wireshark 2?
  28. Capturing traffic
  29. How to capture traffic
  30. Saving and exporting packets
  31. Annotating and printing packets
  32. Remote capture setup
  33. Prerequisites
  34. Remote capture usage
  35. Summary
  36. Filtering Traffic
  37. Berkeley Packet Filter (BPF) syntax
  38. Capturing filters
  39. Displaying filters
  40. Following streams
  41. Advanced filtering
  42. Summary
  43. Customizing Wireshark
  44. Preferences
  45. Appearance
  46. Layout
  47. Columns
  48. Fonts and colors
  49. Capture
  50. Filter buttons
  51. Name resolution
  52. Protocols
  53. Statistics
  54. Advanced
  55. Profiles
  56. Colorizing traffic
  57. Examples of colorizing traffic
  58. Example 1
  59. Example 2
  60. Summary
  61. Statistics
  62. TCP/IP overview
  63. Time values and summaries
  64. Trace file statistics
  65. Resolved addresses
  66. Protocol hierarchy
  67. Conversations
  68. Endpoints
  69. Packet lengths
  70. I/O graph
  71. Load distribution
  72. DNS statistics
  73. Flow graph
  74. Expert system usage
  75. Summary
  76. Introductory Analysis
  77. DNS analysis
  78. An example for DNS request failure
  79. ARP analysis
  80. An example for ARP request failure
  81. IPv4 and IPv6 analysis
  82. ICMP analysis
  83. Using traceroute
  84. Summary
  85. Network Protocol Analysis
  86. UDP analysis
  87. TCP analysis I
  88. TCP analysis II
  89. Graph I/O rates and TCP trends
  90. Throughput
  91. I/O graph
  92. Summary
  93. Application Protocol Analysis I
  94. DHCP analysis
  95. HTTP analysis I
  96. HTTP analysis II
  97. FTP analysis
  98. Summary
  99. Application Protocol Analysis II
  100. Email analysis
  101. POP and SMTP
  102. 802.11 analysis
  103. VoIP analysis
  104. VoIP playback
  105. Summary
  106. Command-Line Tools
  107. Running Wireshark from a command line
  108. Running tshark
  109. Running tcpdump
  110. Running dumpcap
  111. Summary
  112. A Troubleshooting Scenario
  113. Wireshark plugins
  114. Lua programming
  115. Determining where to capture
  116. Capturing scenario traffic
  117. Diagnosing scenario traffic
  118. Summary
  119. Other Books You May Enjoy
  120. Leave a review - let other readers know what you think

Using traceroute

We'll start a new capture and then traceroute. In Windows, it's tracert. We will traceroute to a different device out there on the internet.

We will traceroute out to our trusty Google DNS server; why not? We will then press Enter, and we see the path start to show up here:

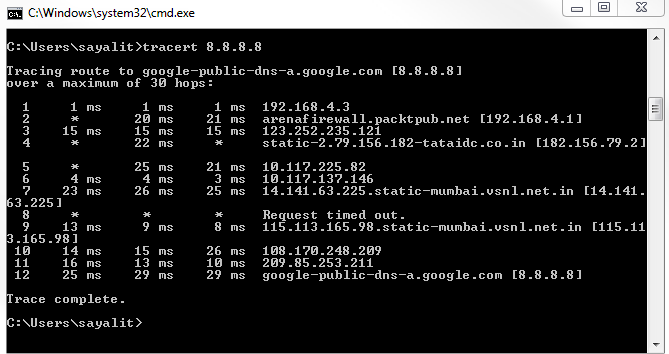
You can see that it has received a number of responses as it went through each different router. Every once in a while you'll notice that it gets some timed-out responses. Depending on the router or firewalls that it goes through, they may not send back information to us. This is why sometimes you'll get gaps in your path, but you can see that it picks up again as it finds another router that responds to us at least. Hence, we're still going through the internet, bouncing through routers, and eventually getting to our destination. If you've noticed, each one of these hops was done three times. So, it gives us an average of the response time for that specific router over an average of three attempts—it goes from router to router.

If we take a look at Wireshark, we should see three requests for each router. What it does in my system is, when it creates a traceroute, it starts out by sending a packet to my destination with a TTL of 1, not 128 or 60, or anything like that:

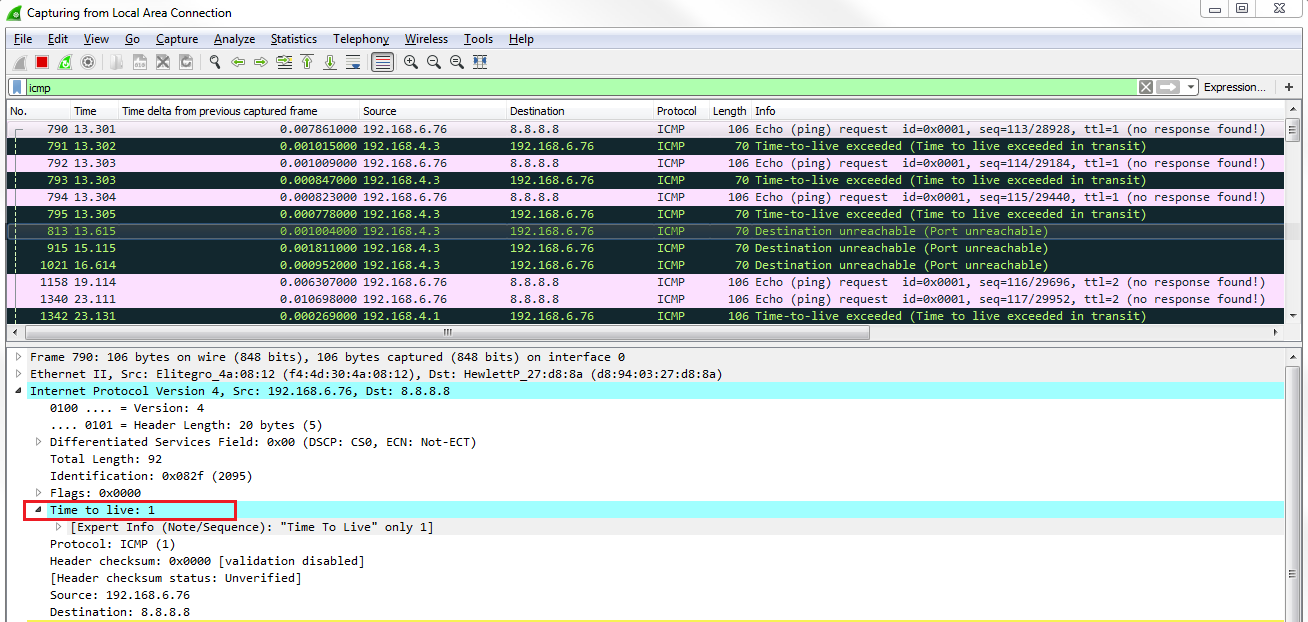
So it'll go to our router that will get it and say, "I can't do anything with this; I need to discard it". The TTLs will go to 0. Then our router will send an ICMP back to me, letting us know that my TTL has been exceeded. What we can see is that's exactly what happens. We sent out a ping request, an echo request with a TTL of 1. Our router responded to say "oh, sorry; I couldn't do it". Then, I do it again for that second attempt. We get a response that says "no, I can't do it". This is done a third time, as well. Then, it goes and creates an echo request with a TTL of 2:

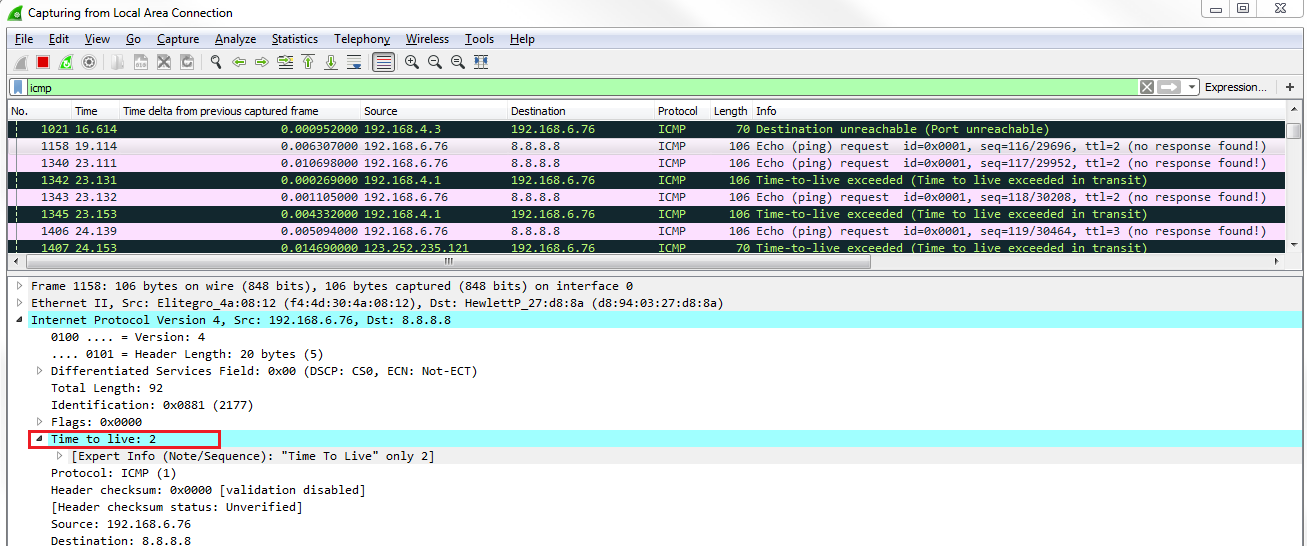
It gets through our router because my router sees that it's a 2; it decrements it to 1 and forwards it; that's completely valid. Then it goes to the next router up the chain, on Verizon, we saw. That router sees it; it sees that it's a TTL of 1; it has to discard it and send back a response saying "no, sorry; I couldn't do it; your TTL has exceeded". I do it again and it responds. Now, we create a TTL of 3:

It keeps doing that for TTL 4 and so on. That's how traceroute is able to map out the routers from point A to point B—because it uses the ICMP TTL exceeded errors in order to figure out that device. This is because it knows that the ICMP packet is generated by the router as an error code back to us. Luckily, we can use that IP information to map out the hops that I go through in order to get to that destination. Very clever.