We'll go over how to filter traffic in data fields within packets, how to create columns on specific fields in our data packets and to sort them, and filter with these more hidden methods that you may not have noticed yet.
We'll go to our packet capture, opening up https://www.cisco.com/. And what we'll do is expand the section that gives us the details of our packet. We'll scroll down and find a packet that we wish to investigate a bit more.
What we can do is expand the sections, which will allow us to easily view the different fields of data within the different layers of the packet. So, if you're familiar with the OSI layers that we use in networking, then this'll look familiar to you. So, we have our layer 2 information with our frame and Ethernet, layer 3 with IPv4, layer 4 with TCP, and so on.
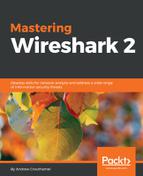
So, let's click on TCP to expand this, and we'll go down to Window size value. Now, the window size is an important field that we'll get into in more detail later on, but what we'll do is view this as a column. So, let's right-click on Window size value and click on Apply as Column.
What that will do is add a new column in our packet list, with the window size value for each packet. Now, you'll see it right-aligned, and with that right up against the information it's a bit hard to see. So, let's right-click on that header up there and go to Align Center and click on it:
Additionally, we can remove the column. We'll right-click and go to Remove This Column to remove it.
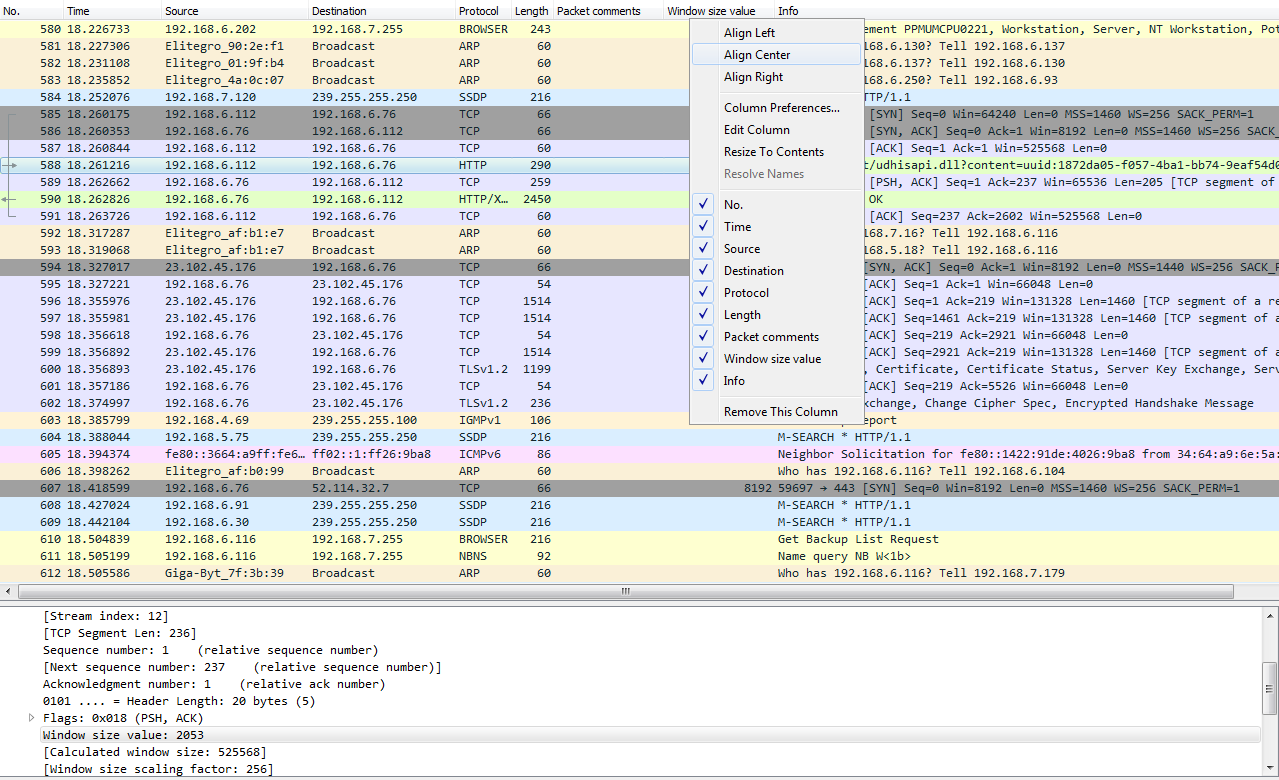
We can go into TCP (or any of these fields) and create filters based on what we see. So, it's much easier than going into the display filter field and trying to find exactly what you want to do because, as I mentioned before when I showed you the website, there are hundreds of thousands of these different things that you can look for. So, instead of doing it that way, you can do it visually with these packet details, and select what you want to filter on. So, let's filter on Source Port. We will right-click on Source Port and go to Prepare a Filter | Selected:
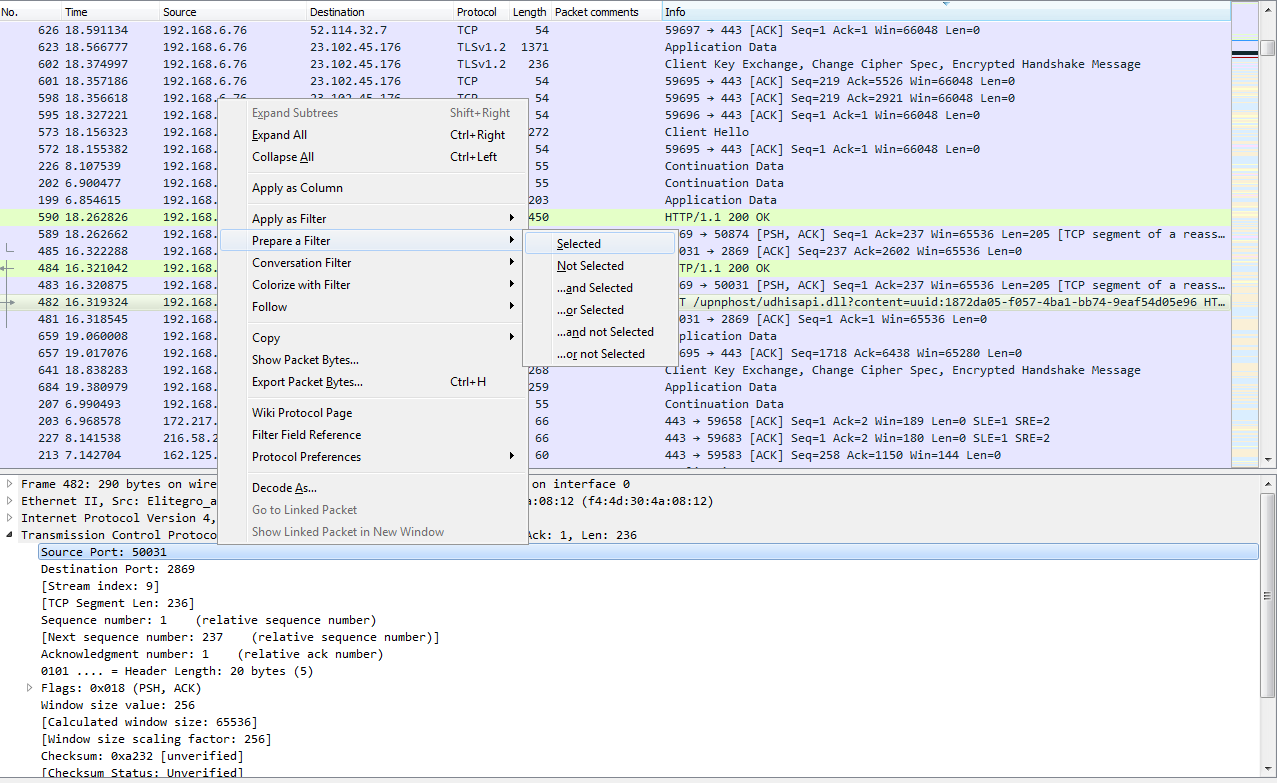
What that will do is prepare a filter in the top section, with the source port information selected. So click on that, and it has tcp.srcport == 50031 (that's the shorthand for source port):
Now, if we apply this, it'll only show source ports that are exactly 50031. What if we want to change that? I can of course go back and change the source ports, as you saw before in the operators and such. And then, we can go ahead and apply that. So now, I have all the packets listed that have a source port less than or equal to 50031.
Let's find another one. Let's go to TCP again. We will scroll down, look into the Flags, and do checksum. So, let's right-click on Acknowledgment, and we'll go up to the top to Apply as Filter and click on Selected:
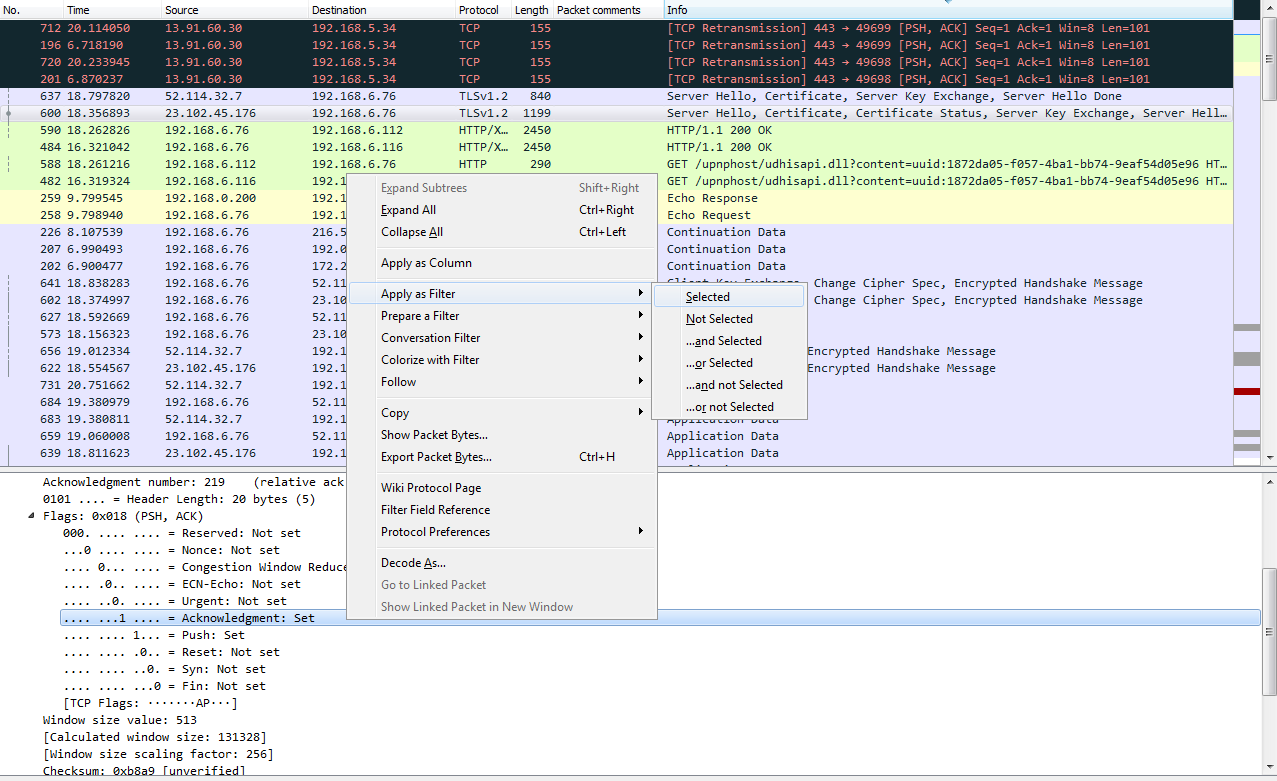
So, we now have all of the TCP acknowledgment packets listed. Now, we can also expand that, and let's go down and find another one—let's find another Flag. So, there's an Acknowledgment, and we'll add Push. So we want to see all the packets that are acknowledgments, but are also Push. We'll right-click on Push and go to Apply as Filter | ...and Selected. You can see that it applied all of the syntax that's required to make this work. So, it takes a lot of the heavy lifting out of creating filters. So now we're looking at all of our packets that are acknowledgments with the push field set.
Let's look at another feature. What we will do is, we'll create a filter for my gateway again. So, there's ip.host == my gateway, and we apply it; now, that's all the traffic to and from my gateway.
Let's sort it by number so that it makes sense. What if I don't want to see the DNS? What I can do is go to DNS, right-click on it and go to Apply as Filter | ...and not Selected.
And what that will do is negate the selection. So I select that, and you can see in the syntax it returns && !(dns):
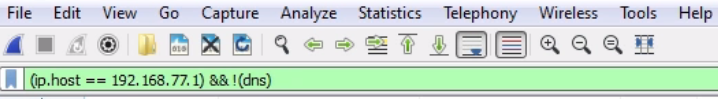
So any time you put the exclamation point in front of something, that tells Wireshark that you do not want to see that.
So, I highly recommend you spend time going through these packet details, learning where they are, what you want to look for, getting used to using Apply as Filter and Prepare a Filter, and understanding how they work together. You can actually take a packet capture that has hundreds and thousands of packets in it, and trim it down to just a few dozen that you actually care about.