
In this section, we'll take a look at how TCP works, what's in the TCP header, and some of the flags and options.
If you'd like to learn more about TCP, you can look at the RFC that's available from the IETF at https://tools.ietf.org/html/rfc793:
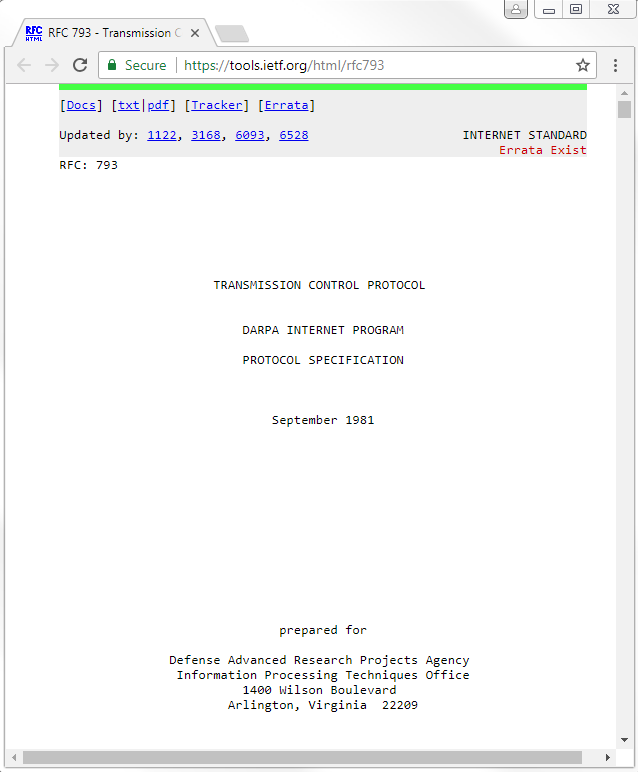
You're looking for RFC: 793 for TCP, which is the original specification for TCP.
In the preceding screenshot, you can see different sections within IETF, which provide a little bit of interactivity. You can click on the different RFCs that have updated the TCP specifications; if you scroll down, it also provides you a nice little table of contents. The RFC shows a little diagram of what the TCP header looks like:
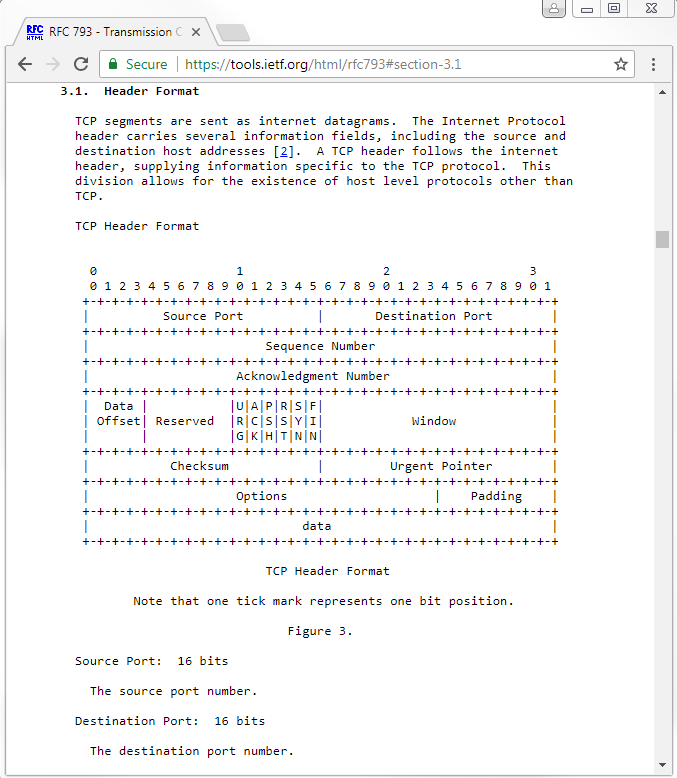
We have Source Port; Destination Port; Sequence Number; Acknowledgment Number; Data Offset; some Reserved bits; Window size; header Checksum; an Urgent Pointer; and Options, which is an expandable section. We have some Padding and then the actual data.
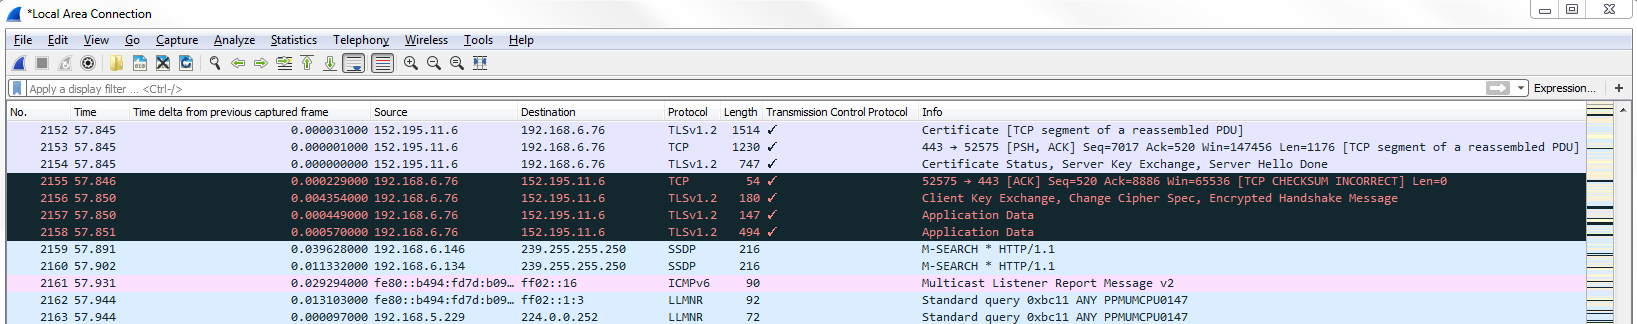
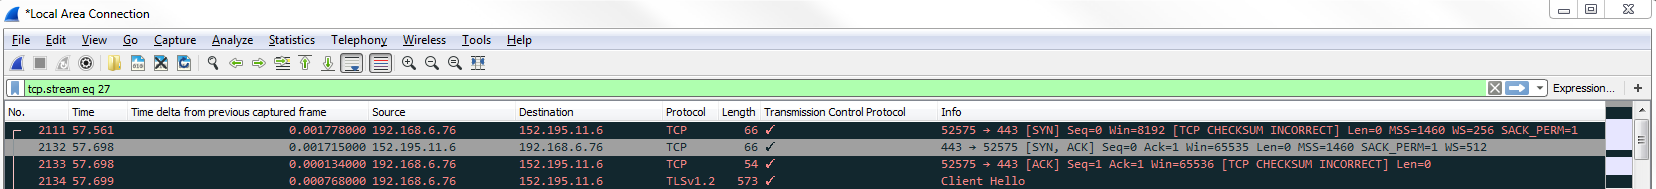
Go into Wireshark and let's go to a TCP packet. We can see we have some TLS traffic that happens to be running over TCP. We can right-click on Transmission Control Protocol and select Apply as column:
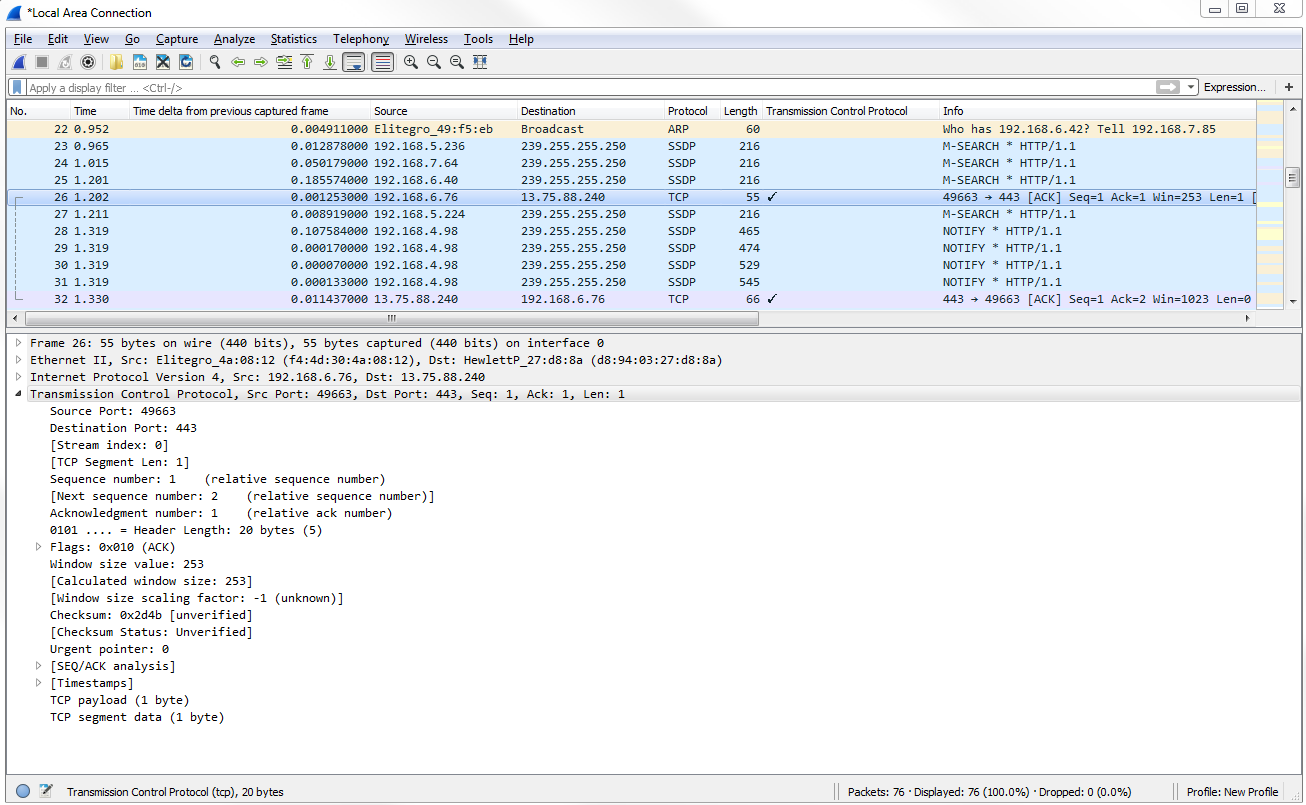
In the preceding screenshot, you can see the tick mark, which means it is indeed using TCP. If we expand Transmission Control Protocol, you'll see the fields that we were just looking at in the RFC.
We have Source Port and Destination Port, and you can see that the system in my computer was accessing this web resource on port 443 and accessing other fields, which you've noticed in other packets that you've looked at, most likely. Anything with a square bracket is created by Wireshark; they're not actually fields within the header, so we can skip them. We have Sequence number and Acknowledgment number. These are relative numbers, if you noticed. We mentioned this a little while back that they started with 1 in this example. The actual raw number is not 1. Wireshark shows it as 1, and as a relative number to make it easier for you to look at. Otherwise, it's a very long number that is harder for humans to look at and diagnose.
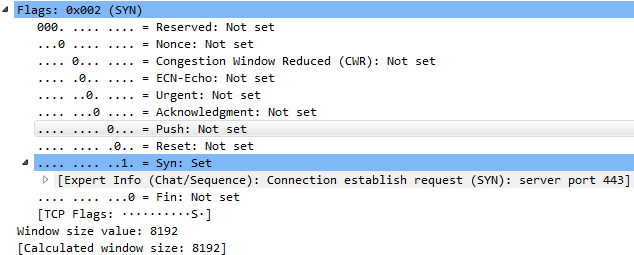
Next, we have Header Length. It tells us how big the header is because the header can change its size in TCP, unlike UDP, so we have to tell it how long it is. We have some Flags, as shown in the following screenshot:
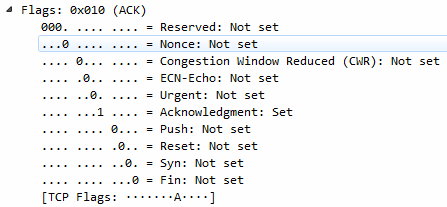
In the preceding screenshot, you can see we have some congestion information; the Urgent bit; Acknowledgment and Push; and Reset, Syn, and Fin. A lot of this stuff will look familiar, such as SYN, Acknowledgment, and FIN with creating a connection and finalizing a connection. We also have Window size value, which tells us how large of a chunk of data we can transmit before having to do an acknowledgment:
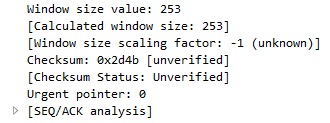
We have a Checksum, which again is unverified, and an Urgent pointer.
If we want, we can go to Edit | Preferences... | Protocols | TCP and enable the Validate the TCP checksum if possible if you would like:
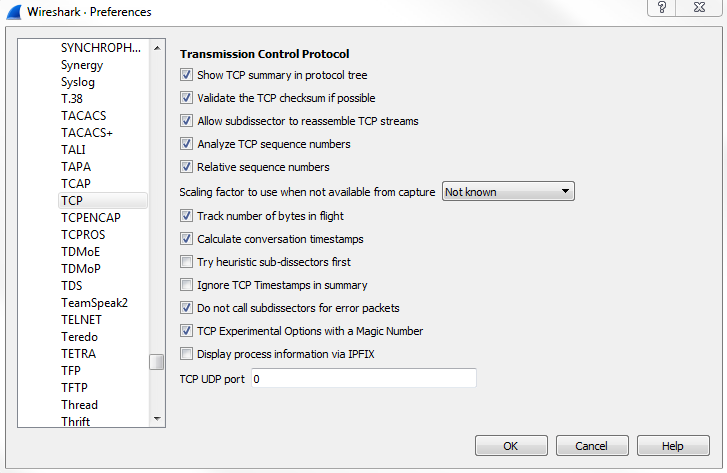
We can see that we now have a correct checksum.
Let's go ahead and create a new capture, and we'll take a look at a handshake creation and teardown of a connection.
Let's start a new capture, and we will generate some traffic. Furthermore, open up a new web page and re-download all the information for that RFC that I showed you from the IETF website. We'll scroll down and look for the beginning of our connection:
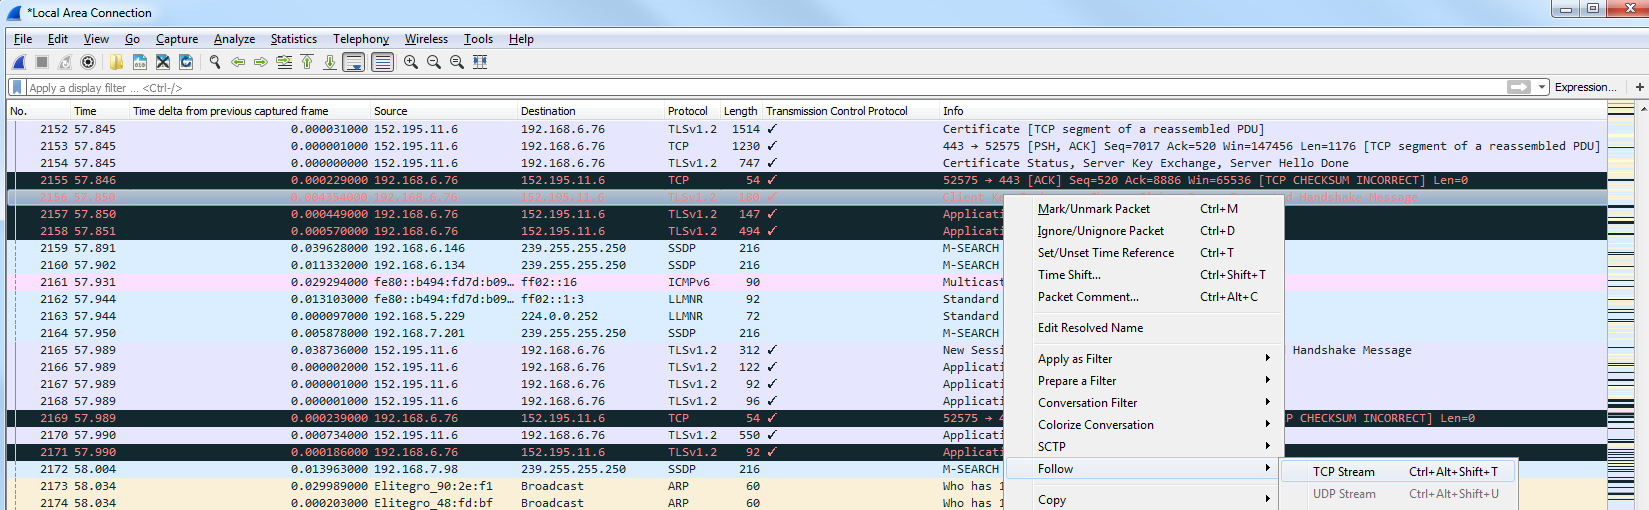
It looks like the website that's being transmitted. It was over HTTPS, so seeing the TLS traffic is what we can expect. We'll right-click on the TLS traffic and go to Follow | TCP Stream:
Next we'll just go back to our main packet list:
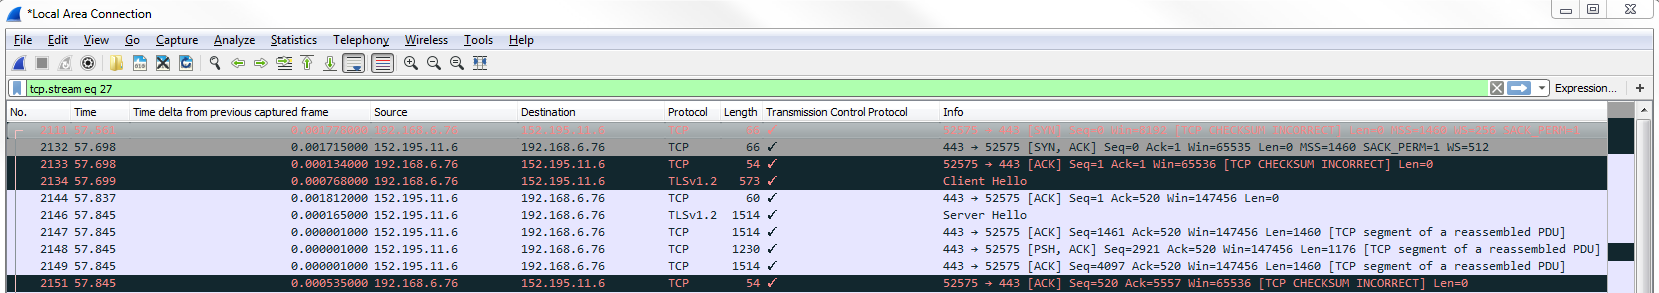
You can see that the filter for tcp.stream eq 27 is listed in the filter option. Now this is our connection to the website for IETF. As mentioned earlier, TCP is connection-oriented. It guarantees delivery of packets. So if you miss a packet, the acknowledgment system builds in and retransmits it. So what happens is that we send a piece of data from the server to the requesting device. We send an acknowledgment that we received it. We also send another packet followed by an acknowledgment indicating that we've received it.
Sometimes, depending on the options and the functionality of the TCP stack in your network card in your drivers, you may allow for some enhanced features that have come out over the years, such as selective acknowledgments and some enhancements to allow you to be more efficient with the way of using this acknowledgement system so that you don't have as much overhead. The creation of a TCP handshake we can see is a SYN, which says "let's synchronize":
Let's create our connection. We have a Syn in the Flags that is Set. That's my system requesting the IETF website create a TCP connection. They respond with a Syn and an Acknowledgment; then we, in turn, send back an acknowledgment, as well. So we have SYN; SYN, ACK; and ACK—the three-way handshake with TCP. After that occurs, we then begin communication to retrieve HTTP traffic, which happens to be laid underneath TLS, in this case. We can see the creation of the TLS connection and some data being transmitted, such as key exchanges and things like that:
Then, at the end of the communication, while sending and receiving whatever data we wanted such as the website being retrieved, our system will then finalize that and with an implicit method say: "let's terminate this; there's no more data to be sent or received". We'll end this TCP connection with a finalized statement.
And so what we do is, in the Flags, we have FIN and FIN, ACK. Sometimes at the end of the list, you'll also see a Reset. So the final method using FIN is implicit, saying this connection should be terminated; there's nothing else to be transmitted. But it's not explicitly told to remove the connection, so the system on either end may end up leaving this connection live—it's up to them.
If you see a Reset at the end of a connection after the FINs, then that's an explicit way of one of the devices saying: "yes, terminate this packet". This is an explicit way of saying: "kill the connection; reset it; nullify it".
If you see a Reset before the FINs, then that may be an indicator of a problem in the connection, where the server or the requesting device solves a problem and resets the connection to try again.
We also have options, which are an extension in the header to allow us to expand upon the abilities of TCP. What we can do is filter on options because, if you notice looking through the header, we don't see anything that says options. If we want to find anything that has options, we need to filter on that.
In the display filter, type tcp.options:
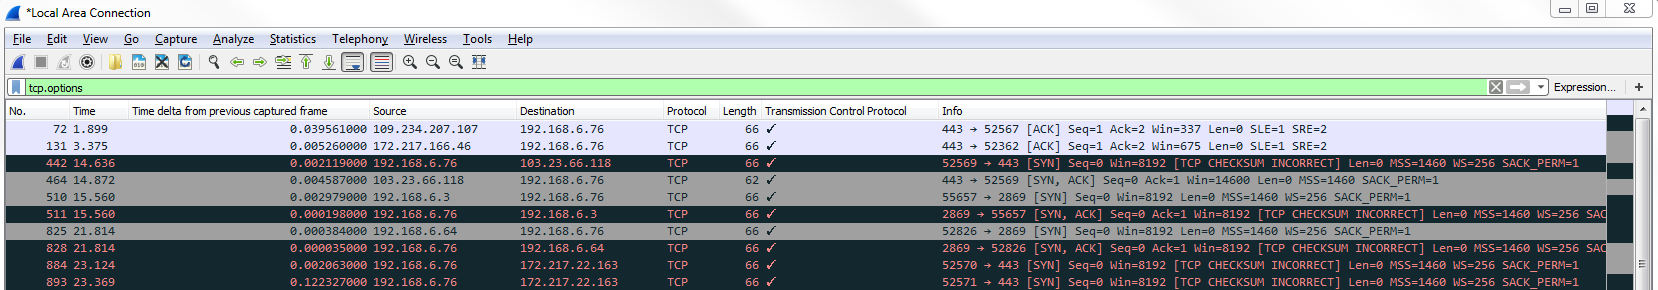
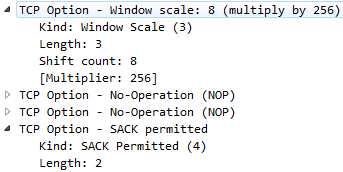
Now we're showing all the traffic that has options enabled in the header. If we scroll down in the packet details area, we have some information about the Options. We can skip the No-Operation stuff. We want to look at things that are more interesting to us, such as TCP Option - SACK permitted and TCP Option - Window scale:
For example, the following screenshot shows a packet that has TCP SACK:
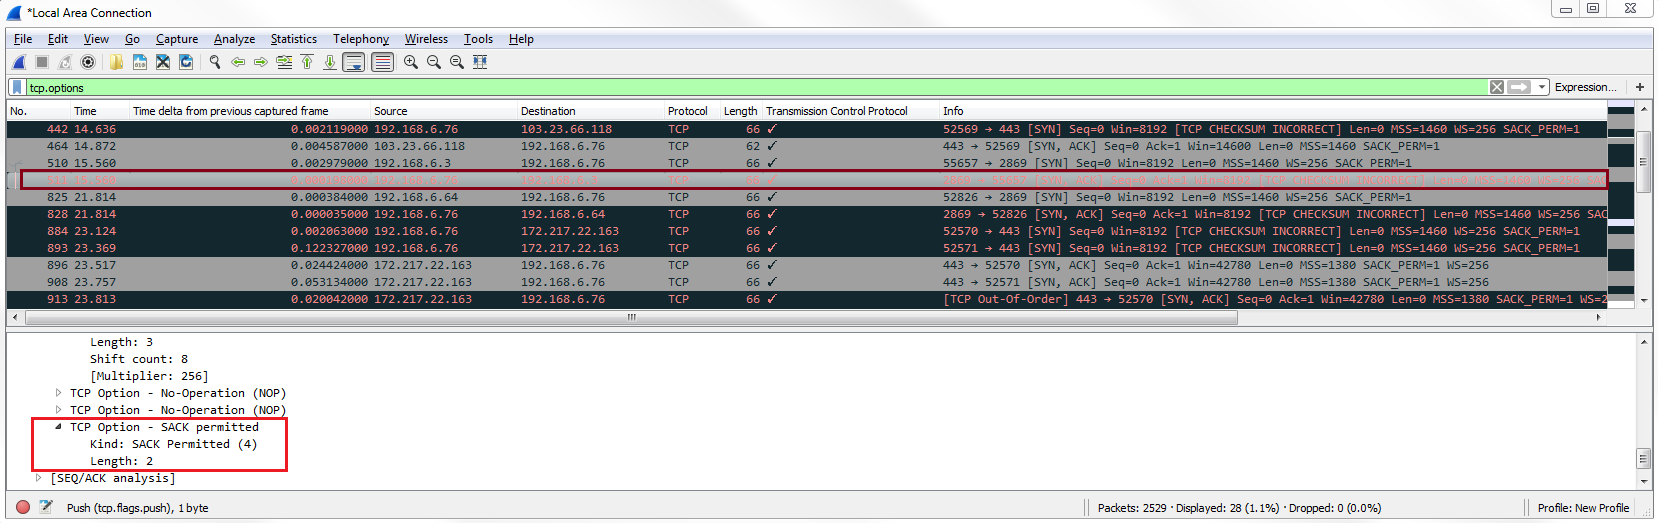
Selective Acknowledgment (SACK) allows you to acknowledge traffic while still requesting for missing traffic, without having the entire block of packets resent to you. So if you're having, let's say, five packets at a time being sent to you before you send an acknowledgment and one of these is missed, without Selective Acknowledgment all five will need to be retransmitted to you. So, the further apart the acknowledgments are between the number of packets that are sent to you, the more efficient it is because you're not wasting all this bandwidth with overhead acknowledgment packets. But if you run into a problem, then more data has to be retransmitted. Selective Acknowledgment is a way of getting the best of both worlds so that you can have large blocks of packets being sent to you without having to acknowledge them every single time but, if you miss one, you can then request just that one to be resent to you; you can still acknowledge all the other packets. If you see TCP Selective Acknowledgments, it means that both the devices have allowed for Selective Acknowledgments and they've agreed upon that. Both sides will have to allow for that feature set to be enabled in order to utilize it.
We also have window scale. Window scale, as shown in the earlier screenshot, allows us to go beyond the initial window size. The initial window size was at a maximum of 65535 bytes, which isn't a lot anymore, so we want more than that. We can do that using window scale. Window scale allows us to multiply the window size by a factor. So you could say 65535 times whatever the window scale is, for example. Then, you could get a very, very large window size in order to most efficiently use your bandwidth.