In the previous section, we went over how to use display filters to limit what you see in a packet capture. In this section, we'll build on that and follow streams. What that means is, in this section, we'll follow TCP and UDP streams to pick out conversations within our packet capture so that we can view the specific communications between each TCP communication or each UDP communication. So, what we have is a packet capture of opening up the https://www.cisco.com/ home page. And the https://www.cisco.com/ home page is not encrypted with SSL by default, so we can see all of the HTTP communications within it without having to add in some sort of SSL key to decrypt it:
In the beginning, we can see the DNS query to Cisco and the response, and then the beginnings of the TCP handshake. Then, we start to retrieve some files and some HTTP traffic for retrieving HTML. Now, we could of course apply what we learned in the last section, and go up to the top and create a display filter for the web server as the host and the TCP protocol, with some other parameters to try and filter out what we want to see, but we'll still have a whole lot of data. You can see this is a very large capture, just to load up one web page.
So, how can we pick out individual communications within this packet capture? Because one thing you'll note is, in a web page, you have multiple files, graphics, CSS files, JavaScript, or whatever it might be that it needs to retrieve. There are a number of different files it has to pull in order to build the web page that you see. Each one of these is its own communication and its own TCP stream. So, what we need to do to follow a TCP or UDP stream is to select a packet within the capture that is within the stream that we wish to view. So, for each of these individual files in this web page, each one's going to be its own TCP stream. So we need to select a packet within that, and then follow the stream.
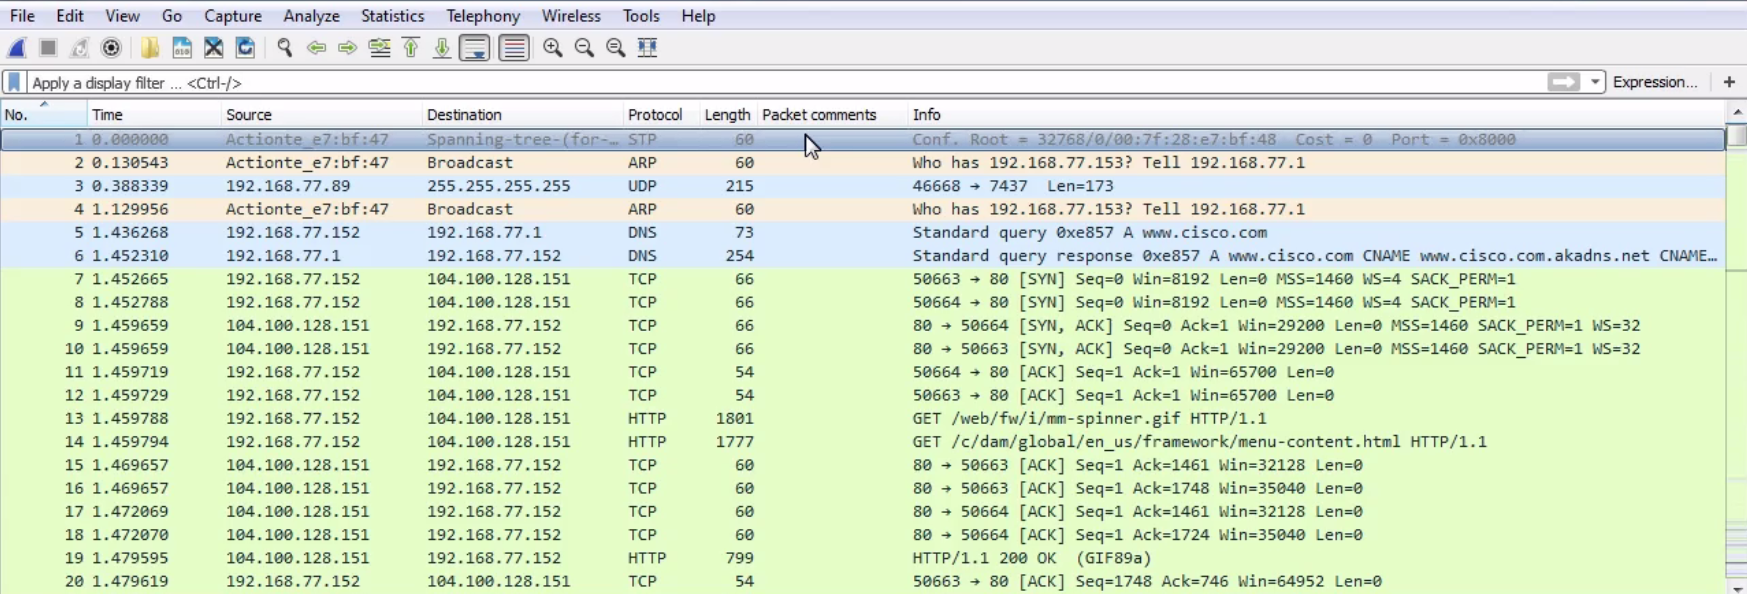
So, let's choose one of the graphics. Let's go up to our spinner.gif. As shown in the following screenshot, we'll right-click on our HTTP packet and go to Follow | TCP Stream:
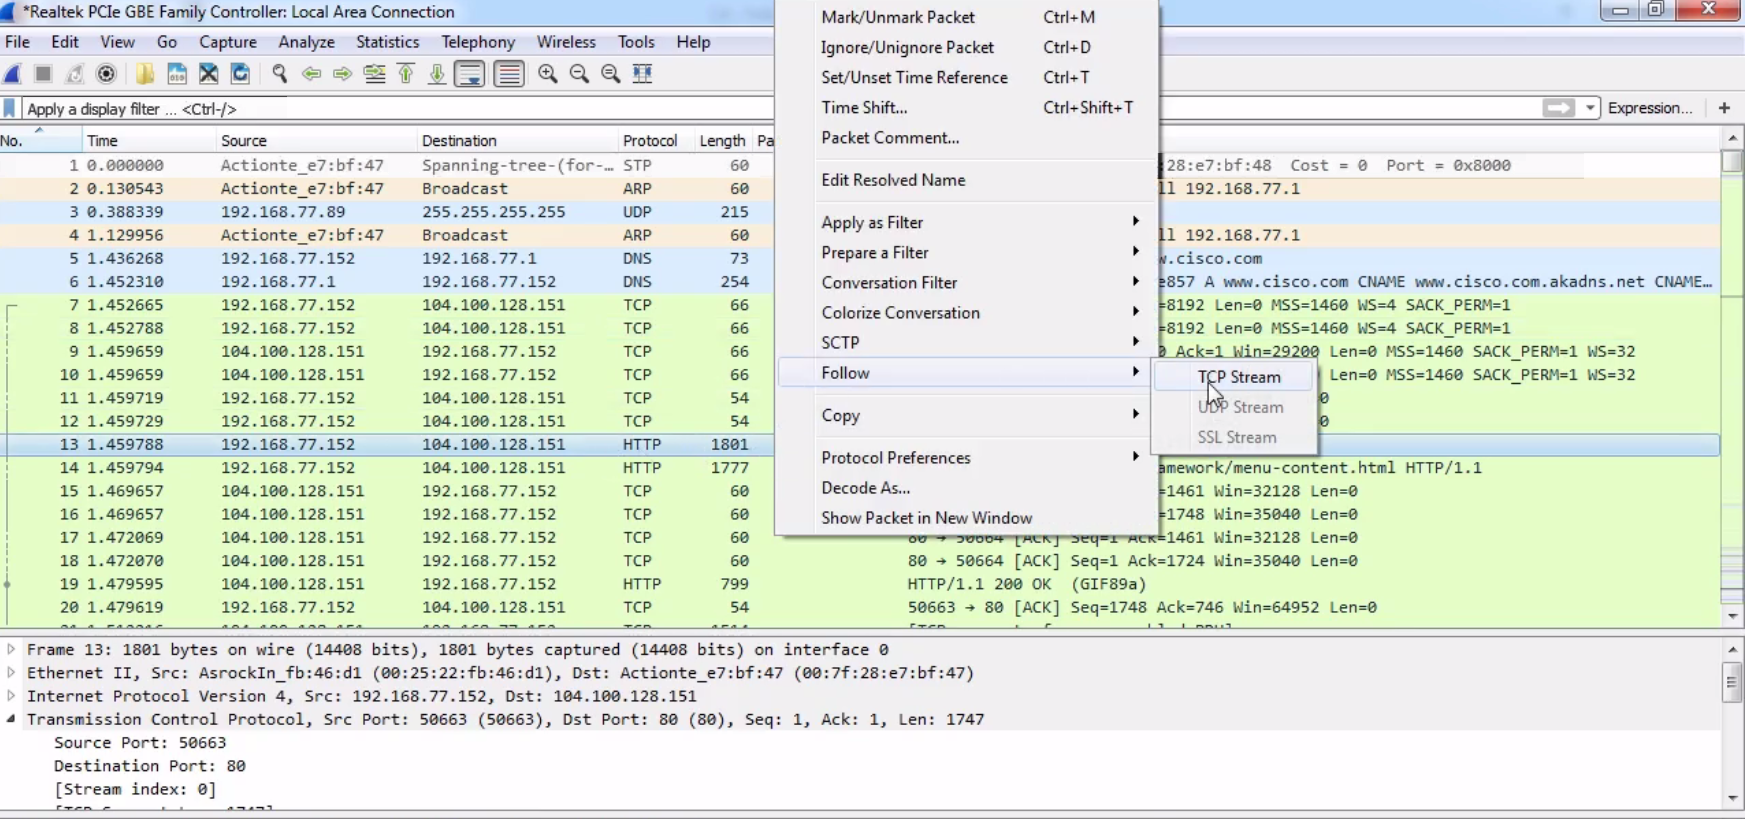
By default, the data shows up in an ASCII format, and that's usually very helpful to you because a lot of the traffic you're probably looking at is text-based. But you may wish to change that when you're doing this follow stream. You can do that at the bottom, where it says Show data as ASCII. You can change that drop-down box and select whatever data format you wish. We'll leave it as ASCII, since we're looking at some HTTP traffic with a GIF transmitted within it. And you can see here that we have red and blue lines. Red is the client and blue is the server, and you can see that at the bottom, where it says 16 client pkt(s), 228 server pkts(s):
We can also change this drop-down box and select the communication that we wish to look at. And as we scroll down in this data view, you will see the blue and red of the client and the server sending their packets back and forth. And, as you may have noted in one of the earlier sections, if you click on the data, it will jump to the packet in the packet view. An additional feature of following TCP is that you can Print or Save as... your packets. So you can actually export these and save them as whatever file format you deem.
You can also follow UDP streams.
Now, you can do the same thing as with following TCP traffic, that is, right-click on a packet and go to Follow, and you can see that UDP Stream is available for us to click on.
Select UDP Stream and it'll do the exact same thing. It will show the data up in the top pane. It may be useful or not, depending on what kind of data it is. It will allow us to perform all the same features as following the TCP stream.
In this section, you learned how to follow TCP and UDP streams and to pick out specific conversations within your packet capture and data flows. Next up, we have advanced filtering, where we'll get into picking out more nuanced sections within a packet capture and within your packets to enhance your ability to filter your traffic.