
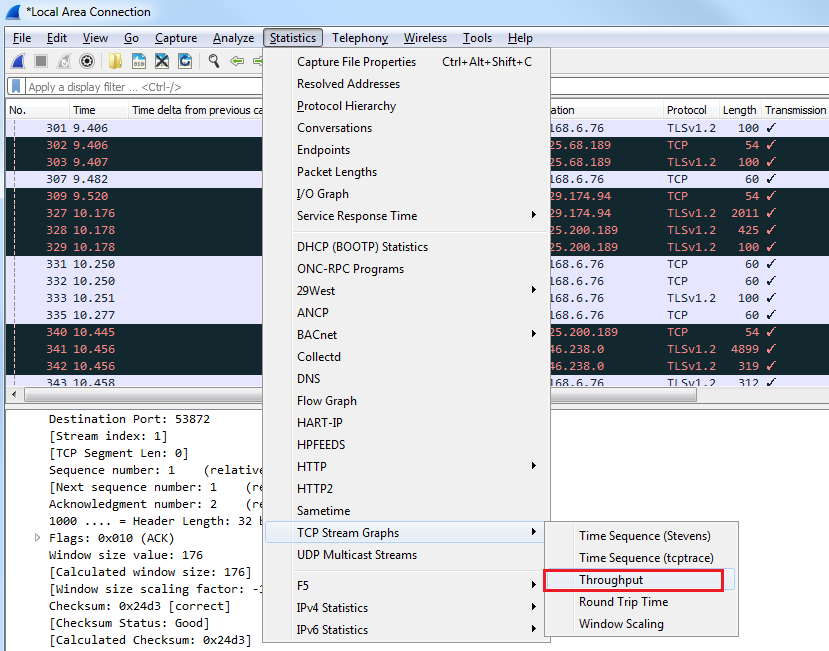
One of the first things we'll do is go up to Statistics | TCP Stream Graphs | Throughput:
When we click on Throughput, we will see that a graph comes up:
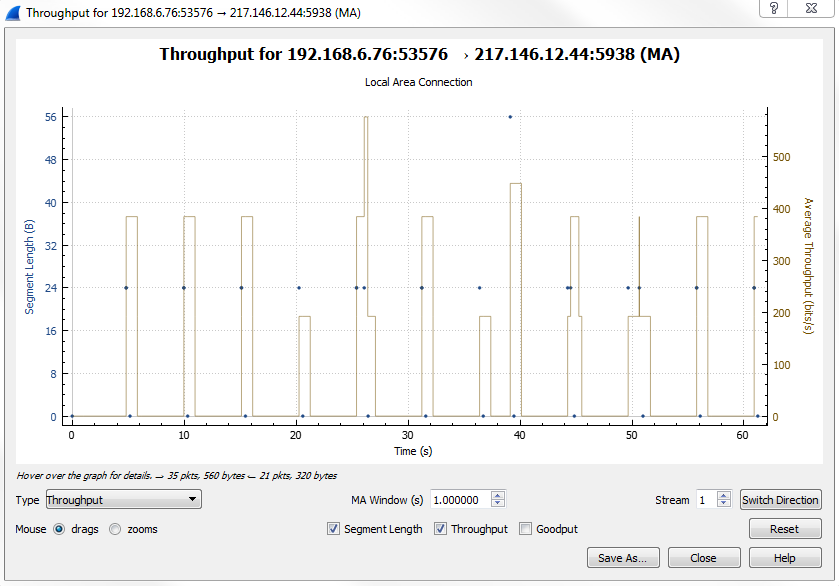
Whether it's graphing I/O rates going into the section, going for TCP stream graphs, or anywhere like that, all the graphs are unidirectional. Depending on what packet we have selected, it will show us the throughput for that or the I/O rate, or whatever it might be that we are graphing—it'll be for that one unidirectional transfer. As you can see we'll go from 192.168.6.76 to the public address as we're trying to pull HTTP. If you don't see what you're looking for in the graph, click on the Switch Direction button:
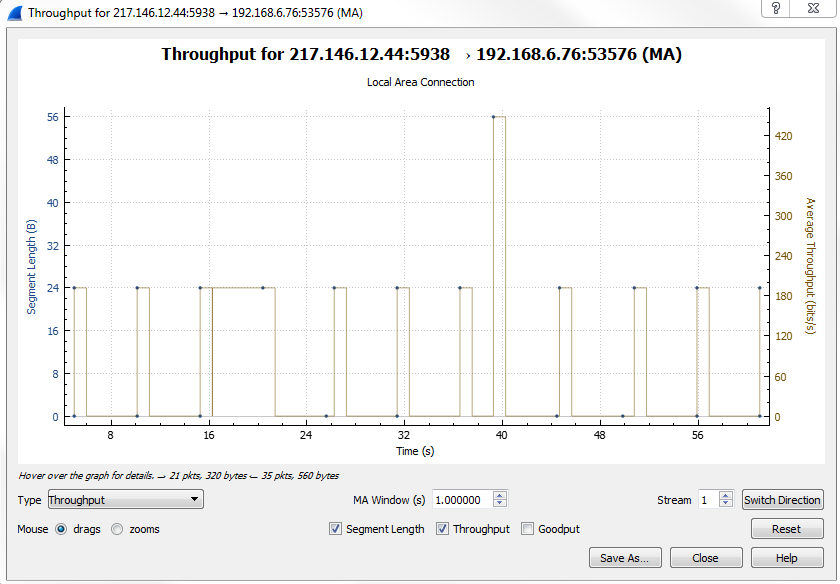
This'll provide us with the opposite direction. We can see here that we're getting the throughput from public address with port 5938, the server, and that it's going to our private address that was the web browser. We can see that we have the throughput graphed. We have the Segment Length and we have the throughput itself in bits per second. What you can do, in the latest version of Wireshark, is you can drag the graph around in order to be able to view it more effectively or you can use your scroll wheel to zoom in. Alternatively, you can use the plus or minus signs on the right-hand side of your keyboard or in the keypad area. I like to use the scroll wheel just because it's handy and almost every mouse has it.
Also note that you can change the Stream that you're following. If there were multiple streams that we wanted to look at, we could change the stream number that we're in. Here, we'll leave it as 1:
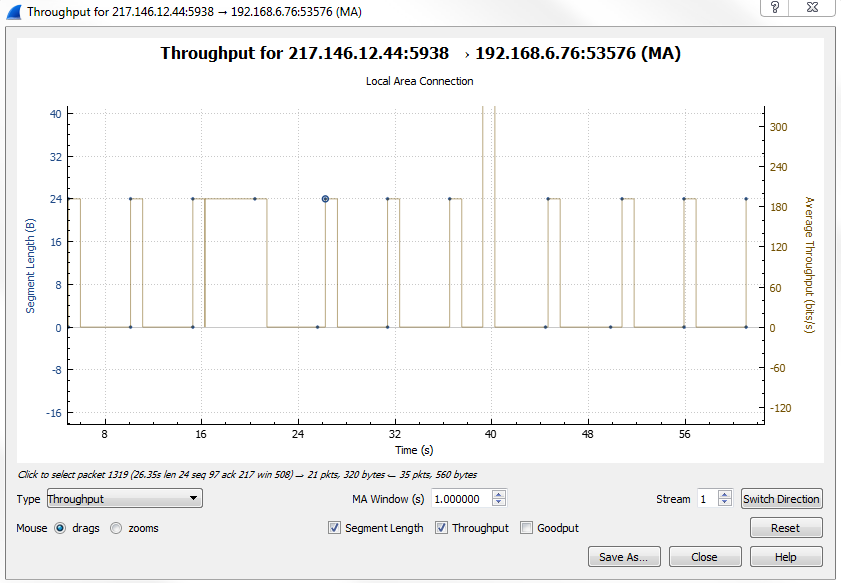
Another nice feature with the graphs in Wireshark here is we can click on any point in the graph and it will take us to that packet. Let's click between the little gap seen in our throughput, and we can see that Wireshark takes us to that section of packets.
If you noticed, when we went to Statistics | TCP Stream Graphs, there were several options to choose from:
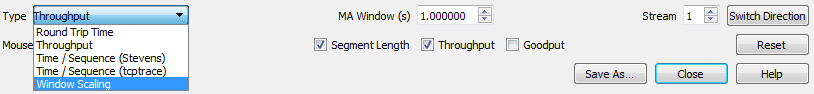
You don't have to close this window and go back to the Statistics window and open it again; you can switch between them easily by simply selecting whatever type you want.
Let's go to Time / Sequence (Stevens):
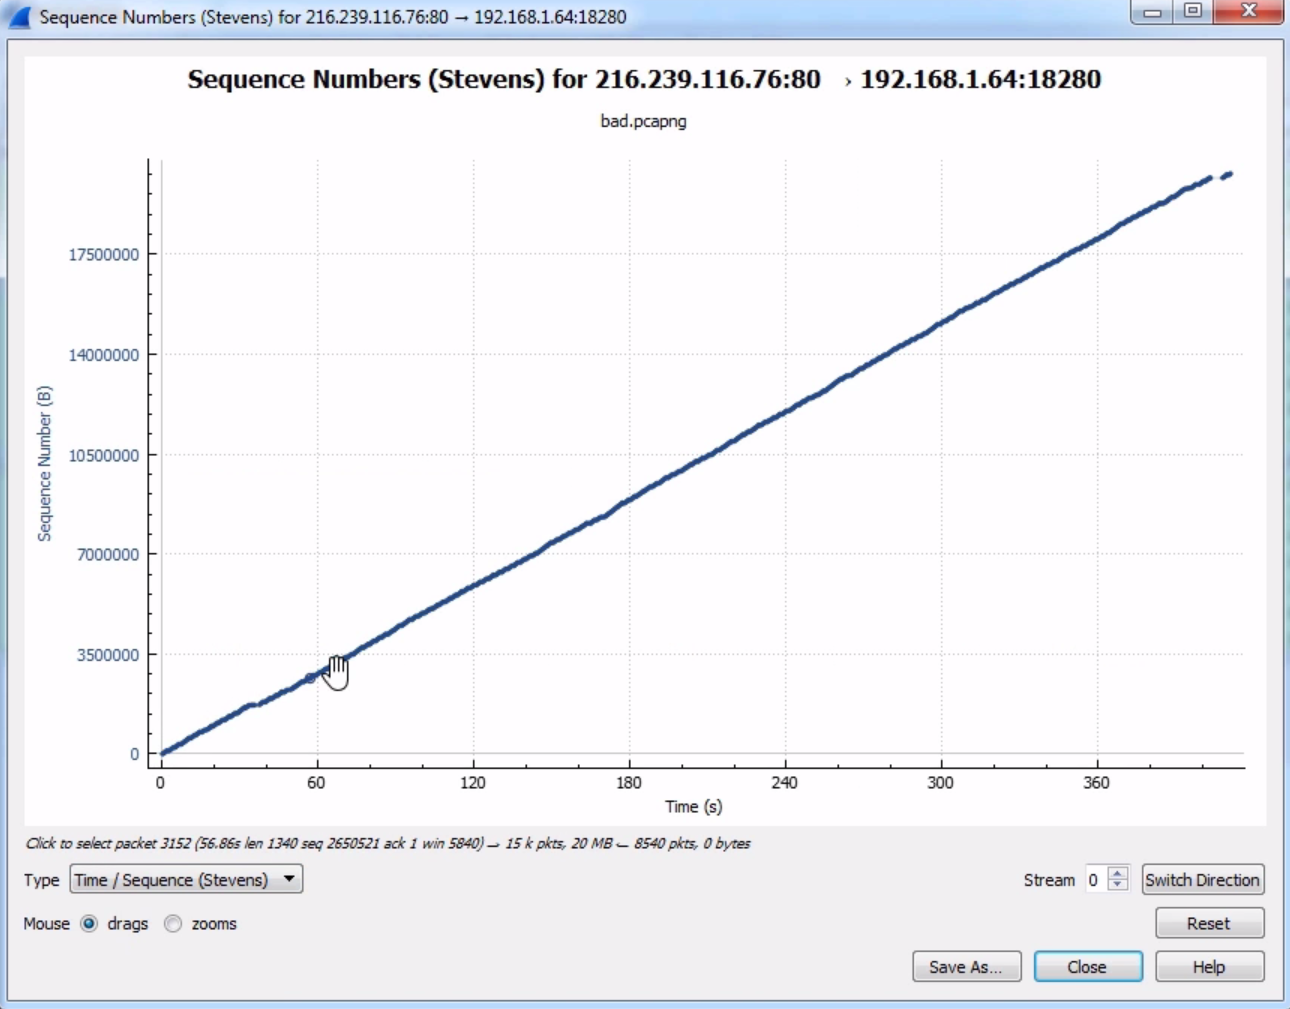
You see here that we have a nice diagonal line in our time sequence. What that's showing us is the sequence number continually incrementing from packet to packet. Sometimes, you can view issues in your packet capture with sequence numbers by seeing a drop in sequence numbers or maybe a flat line, where it does not increment upwards in the y axis and it just continues on the x axis. If you see anything other than a diagonal line, that's indicative of issues in your packet capture. So what we see here looks relatively good. We can close it.