In this section, we'll go through display filters. And, in regards to display filters, we'll talk about how to sift through a large packet capture. So, a common method of capturing traffic is to not use the capture filter and instead capture everything that the interface can see, and then simply filter out exactly what you want to view because some of these other packets may be useful in diagnosing some sort of problem. We'll also go over quick access filter buttons. So, if there's a common thing that you need to filter on all the time in your environment, you can create a quick access button and simply click on that, and you don't have to type out the display filter every time. And there are a number of filter operators that you can use to combine multiple filters to create a full expression as to what you want to specifically filter on:
- eq/==
- le/<=
- or/||
- not/!
- and/&&
- ne/!=
- gt/>
- contains
- It/<
- matches
- ge/>=
- ()
So you could combine the IP address filter with a port number filter, or something related to TCP, or something related to two MAC addresses. You can combine them or exclude them in different ways using these filter operators. You can use either the Word version of the operator, which is what's before that /, or you can use whatever's listed after the /, which is like the mathematical equivalent of the Word option. There's also a parentheses, so you can also combine filters and their operators together, kind of like a mathematical equation. So, you can have certain comparisons, such as two OR statements, compared first, and then have it with something else as an addition, such as an AND statement.
So, to work with display filters, let's get some traffic first. I'll start a capture on my primary interface without any capture filters. So, we will have some packets coming in, which will be whatever's idle on my system at the moment.
You'll see up at the top of the screen that we have a Apply a display filter entry box. And it also has that bookmarks icon, just like the capture filters did:
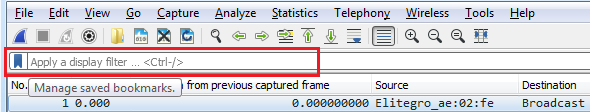
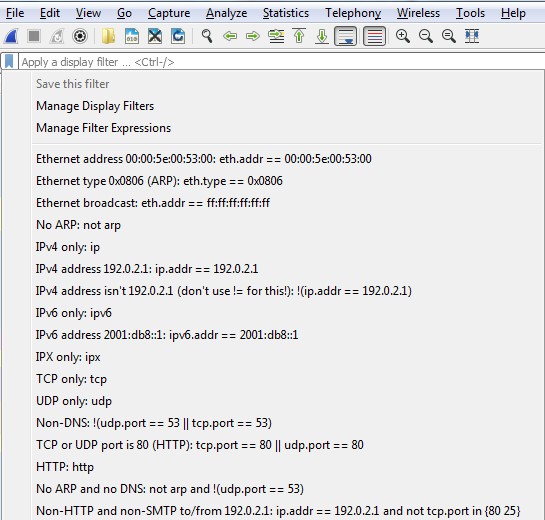
So, let's get some packets to work with. I'll start a capture on my primary interface, without any capture filter entered. So we'll capture everything that's occurring on my system; currently, whatever's in the background. So, after we have a good amount of traffic to work with, you will notice that at the top we have a textbox that says Apply a display filter, and that works just like the capture filter textbox does. We can type in whatever is the display filter that we're looking for. We also have the bookmarks icon on the left, just like with the capture filters. And if I click on that, it gives me my saved filters. I can have a whole bunch of them listed, as shown in the following screenshot—these are the common ones that come prebuilt with Wireshark:
Just like with the capture filter, if I enter one filter into the textbox, I can save it. Alternatively, I can go in and manage my display filters, and I can add and remove them manually, as well, just like with the capture filters.
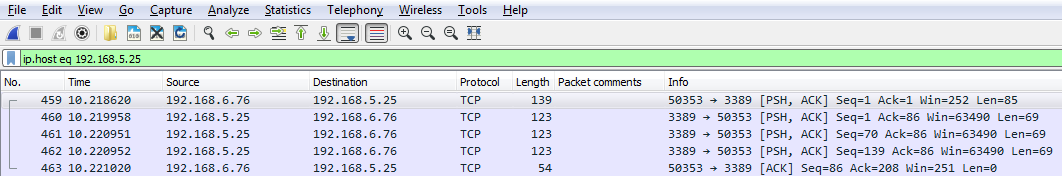
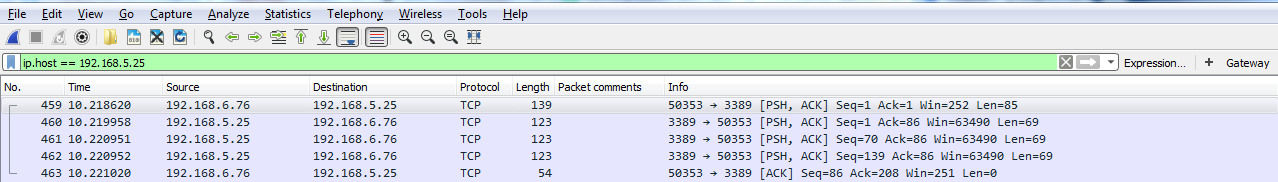
Let's start off with filtering by something. So, let's do ip.host, which is eq 192.168.5.25, so that'll be my gateway:
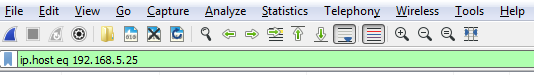
Then, I can either click on the arrow on the right-hand side to apply it or press Enter. And when I do so, there's all the traffic to and from my gateway 5.25:
We can also filter by source or destination. We will use the keyword host, so we will input ip.host.
We could also filter by source, which is src, but if we do it this way we'll only get the traffic originating from 5.25; we'll not get the return traffic. If we do the same thing with destination, dst, we'll get the return traffic, but not the originating traffic.
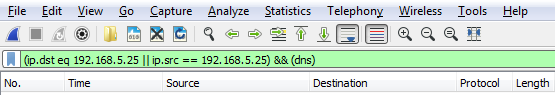
So, how do we get this traffic? We can chain it together using one of the operators, like I mentioned. So, we'll tell Wireshark we want both these destinations in the source traffic. We have ip.dst up there already. So, what we'll do is combine it with an OR. And if you remember, you can either type or, or the two pipe symbols. And we'll type ip.src == and put in the IP address of my gateway.
And now that it's a valid display filter, it's turned green. I can just press Enter and there we go:
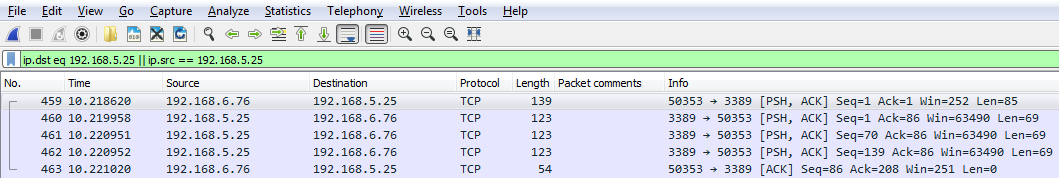
Now we have both directions of traffic, just like if I'd typed in ip.host. So you can see how using some of these shortcuts that you know of in the display filter options can make things faster for you.
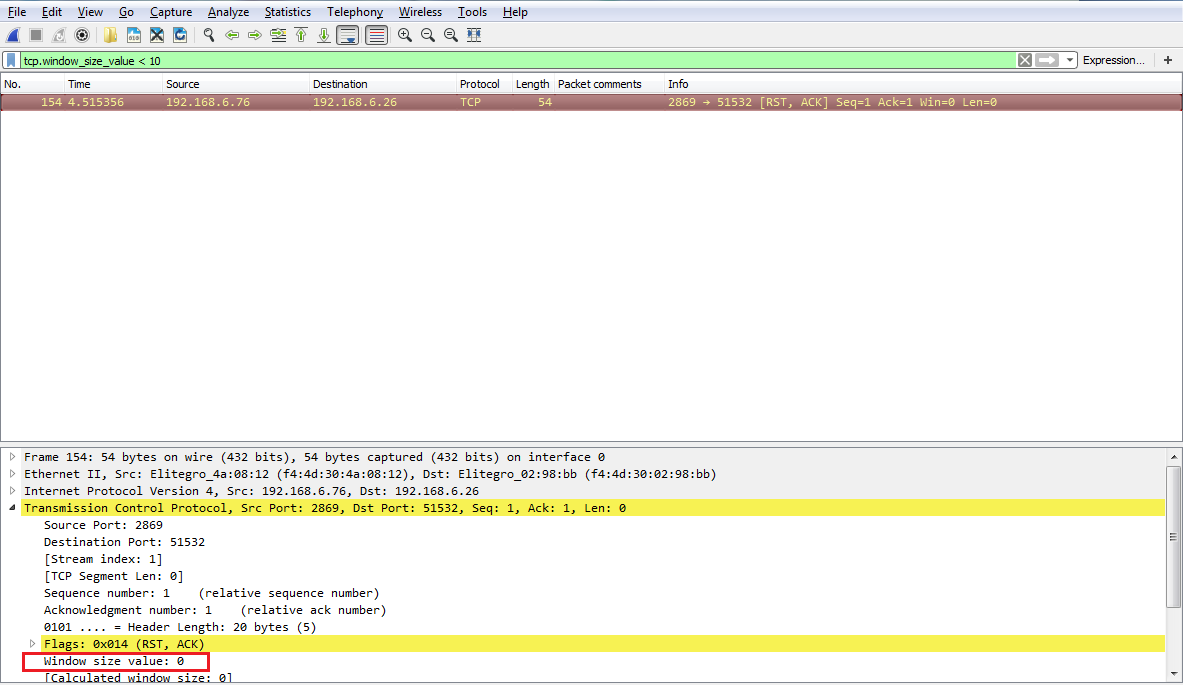
Another interesting thing we could do is, let's say we need to troubleshoot something with a slow transfer with TCP. So we want to look at the window size, so we type in tcp.window_size_value < 10. So, let me press Enter and there we go. So, we have one packet. Remember, we didn't define any sort of IP address. Any of the packets that Wireshark has captured that has a window size less than 10 will be shown to me:

If we expand our TCP details, you'll see there's the window size; it's certainly less than 10:
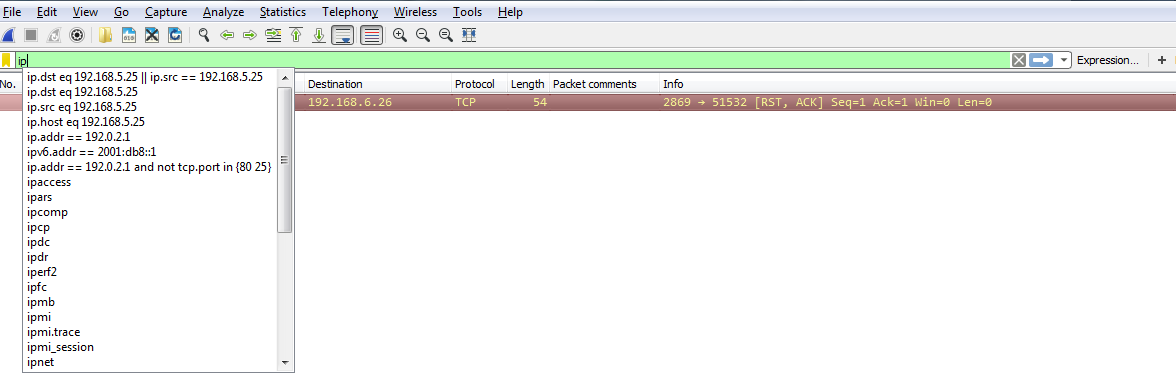
So, let's create an example using the parentheses I mentioned. So, what we'll do is filter based on my gateway again. What I'll do is quick-access one of my last used display filters. So, I'll type ip. Now, if you look there, it has the most recently used ones at the top. So, I'll use the down arrow, select the one I want to use, and press Enter:
We'll add some parentheses to that. Now, I'll add in dns. So I want to see any traffic to or from my gateway, and it's a DNS entry. So I'll type &&(dns), which is a shortcut for the DNS protocol, and I press Enter:
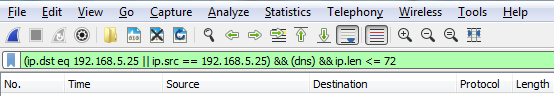
Now, we can go even farther. So we can say && ip.len <= 72. And now, I've trimmed it down to any DNS packets to and from my gateway that are less than 72 bytes in length:
So, you can see how this is really powerful, and how you can trim off exactly what you want to see. Now, this is a very powerful feature, with a lot of filters in it. In fact, there are tens of thousands of filters for two thousand protocols. So, if you go to https://www.wireshark.org/docs/dfref/ for display filter reference, it will show you all of the different fields that you can use. So what we'll do is we'll click on I and look for ip. There we go. Let me click on that, and then that will tell us all of the subfields that we can filter on. So, ip is the protocol. Now, we're curious about, maybe, the address or the checksum, destination, source, types of flags, GeoIP information, and so on. So this is a great reference to search for what you wish to filter by. Now, the last feature we'll talk about for display features is creating the quick access buttons. So, if you look over on the right, we have a plus icon, and it says Add a display filter button:

So, if we click on that, we can then create a Label and enter a filter to save. So, let's say I want to make one for my Gateway. I'll make a Filter by saying ip.host == my gateway. Once you click on OK, you will see a button for Gateway now. So if I have a big capture with hundreds and thousands of packets, I can simply click on my Gateway button and it instantly applies that filter:
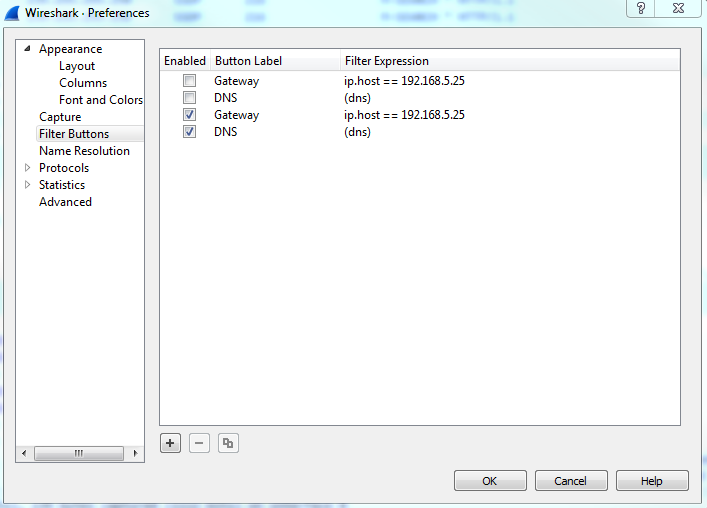
Now, if you wish to remove some of these buttons, the easiest way to get there is to simply click on the plus icon again, and then there's a button on the left which says Filter Expression Preferences.... That will take you directly into Wireshark's Preferences section for this, and then you can just edit or remove whatever buttons you need to change or you don't want:
So, in this section, we went over the basics of the display filter and created quick access filter buttons. Up next, we'll talk about filtering by TCP and UDP streams and show specific conversations within our packet captures.