In order to capture traffic inline for Wireshark, you need to place some sort of device on the wire where it can see the traffic being sent and received, and then replicate that traffic to additional ports for your diagnostic machines, which might be possibly running Wireshark, for example. One of the early devices that we can use for older networks that we're running half duplex is the hub. This is the predecessor to the switch, and it has a very basic functionality where it sees the electrical signals being sent across the wire, and it replicates those electrical signals out all the other ports that it has, without any care as to what's on these actual ports. It's just a splitter, basically. That's great for a slower, older, half-duplex network; but for a modern, switched, full-duplex network, you'll need something a little bit fancier. One of the devices that you could use is a TAP.
There are four different TAPs available:
- Non-aggregating TAPs
- Aggregating TAPs
- Regenerating TAPs
- Link aggregation TAPs
Each one of these TAPs have different functions. I mentioned switched port analysis (SPAN) ports or port mirroring. In a modern-switched network, this is a very common way of receiving traffic. If you have a managed switch, such as a Cisco switch or whoever's it might be, you can go into the switch and tell it to replicate the traffic that it sees on one port to a different port. This port could then be connected to your Wireshark machine to capture traffic. It's very useful for modern networks because there's no other hardware required. You can just go into the switch and tell it to replicate the data out to your monitoring system. In order to capture traffic on wireless, you need to be aware that there are multiple modes that you could use. There are two modes that we will be discussing:
- Monitor mode: This mode receives all packets on a specified channel. So, in the US we have 11 channels on 2.4 GHz, for example. You could tell your network card or wireless card to receive all traffic on channel number 3, and then it would capture all of that traffic for any SSID and any network that is on channel 3.
- Promiscuous mode: This mode is more common to find in your wireless drivers, and it allows you to receive all packets on a connected SSID, on a connected network. If you're connected to your work network or your home network-whatever it is you're trying to diagnose-it'll capture anything that's traversing that network name and that SSID. But it will ignore any others on the same channel, and it will certainly ignore anything else on any other channel, as well.
In the following screenshot, we can see that Wireshark is running. You can see that I have a list of interfaces here, including a local area connection and some virtual adapters. I do not have any wireless adapters on this computer, or else they would show up here as well. And any other additional network interface controller (NIC) cards that you might have-wired cards, it doesn't matter-they'd all show up here in a list:
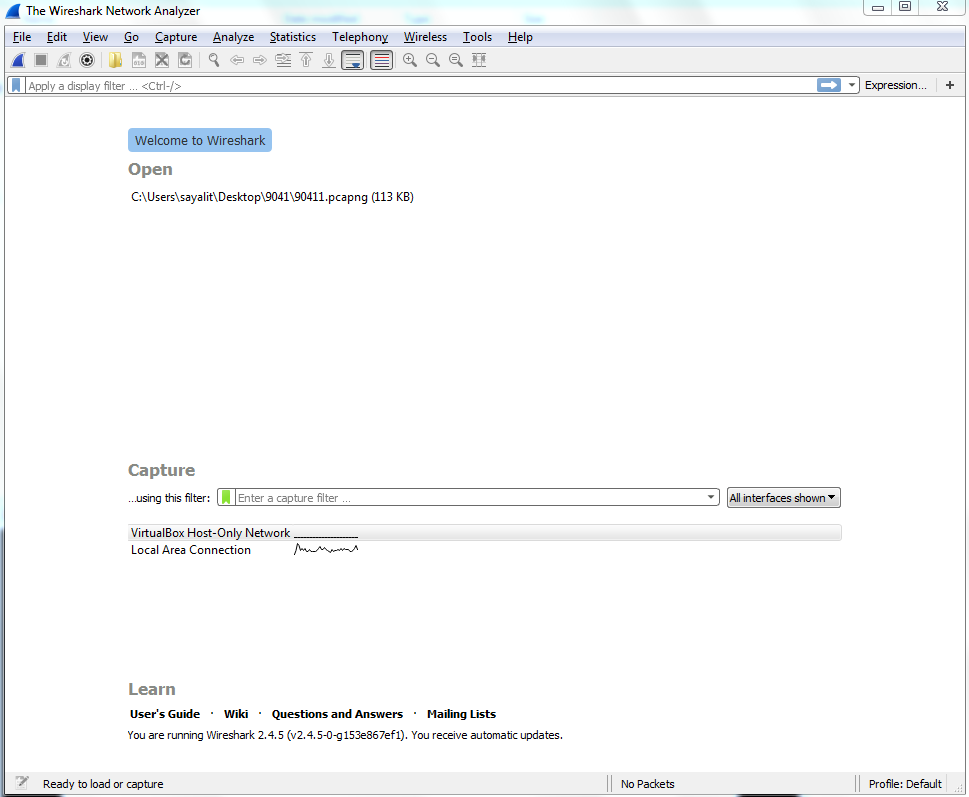
You will also see that there's a chart that's continuing to be drawn by Wireshark, and it's showing us the amount of data that it sees on each connection. This is actually pretty useful, especially if you have a diagnostic computer that has many different interfaces—the different SPAN ports, or whatever it might be. Maybe you turned on SPAN to a specific port that's receiving a lot of data, and you don't know which one it's connected to on the monitoring system. You could take a look here. Whichever port is receiving the most data or the expected amount of data might be the one that you want to try and capture on. So I find that useful on, for example, crowded systems.
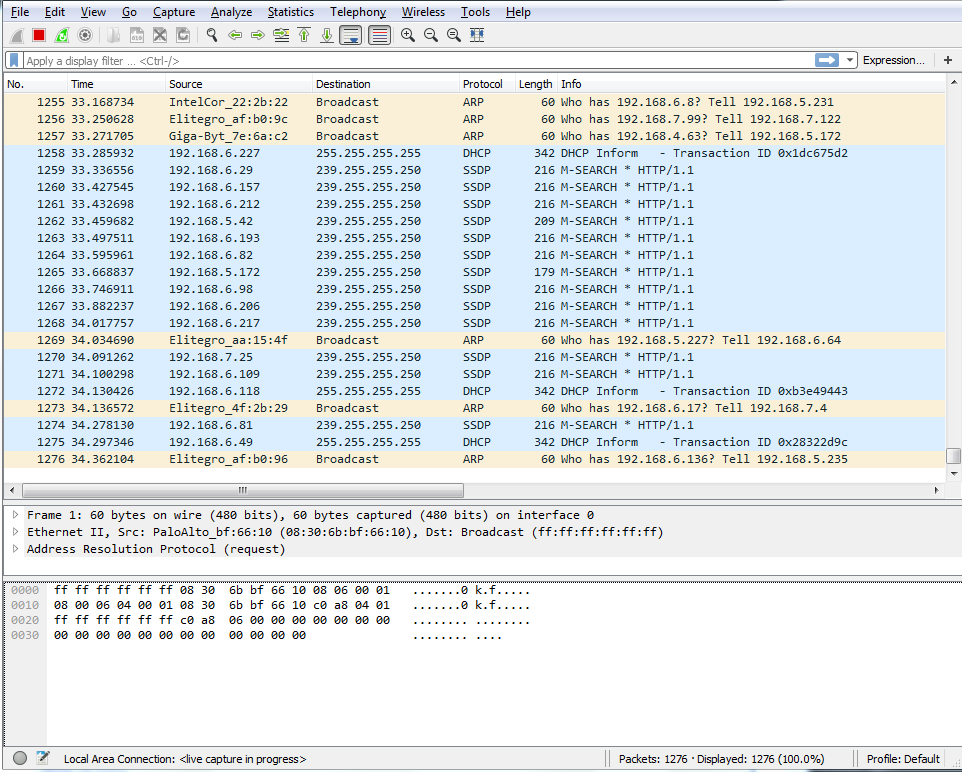
In order to capture traffic, all you have to do in the latest version of Wireshark is double-click on that and it will begin capturing your traffic, and you can see that traffic begins to scroll by. In this computer, I'm not actually doing anything which is very interesting, considering how much traffic is being sent and received, but there are services that are running in the background and there's possibly minimized web browsers, and things like that. But you'll see there's quite a bit of communications just on a standard, idling computer:
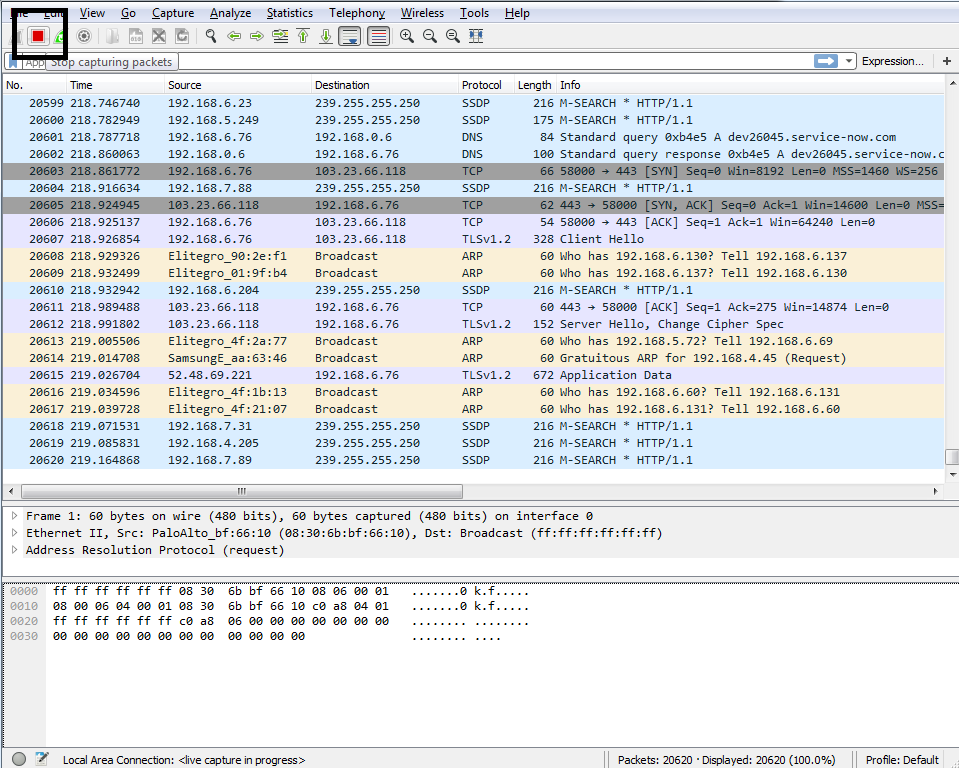
In order to stop this capture, you just go up to the top and click on the stop icon:
You'll notice that the packets were scrolling by and being updated in real time. Well, this is useful for some situations—it might not be useful for all. So, if you have a system that's receiving a lot of data, for example, possibly gigabits per second or if you're trying to run this on a computer that's very old and slow, that might not be an ideal situation, especially if you're using the GUI.
So you can turn that off so that it doesn't use the graphics card and processor power to try and update this screen for you in real time. In order to do that, perform the following steps:
- Click on the gear icon, as shown in the following screenshot:

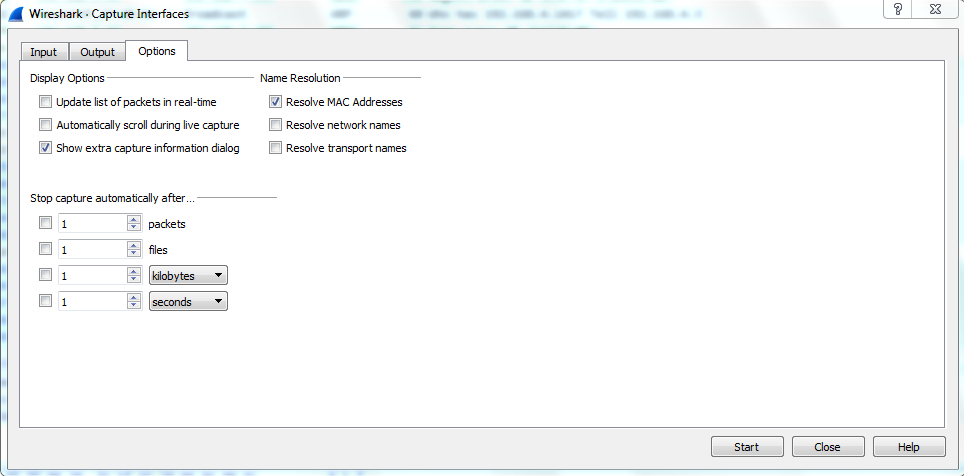
- Go to Options, and you can see that there are some check boxes here that we can turn off. So, you can see the Update list of packets in real-time. If I uncheck that, it will prevent the list from populating as it continues to receive packets, and I can turn off Automatically scroll during live capture. You will notice that the scroll bar on the right went down to the very bottom. If I turn off Automatically scroll during live capture, it would remain up at the top. So these two things are very helpful to disable if you are running on an older computer, like I mentioned:
- You can also select multiple interfaces. If you go back up to that Options selection and you look at the Input tab, you can select multiple interfaces with the Shift key; or, with the Ctrl key, you can select them individually and then click on Start, and it will be then capturing on all the interfaces that you selected. Depending on your situation, that may be a useful feature.
In this section, we went over some different ways of capturing packets; how to get them into your Wireshark capturing system. Up next, we will save those packets and export them in various ways.