In this section, we'll take a look at how to create coloring rules, how to remove them, how to make your own, how to colorize conversations, and filter traffic by the coloring rules that are applied. Let's start.
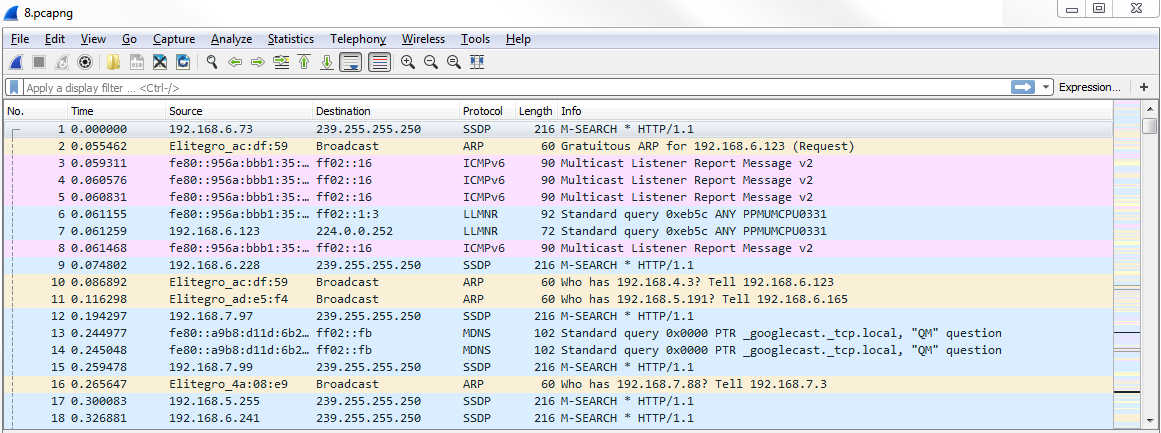
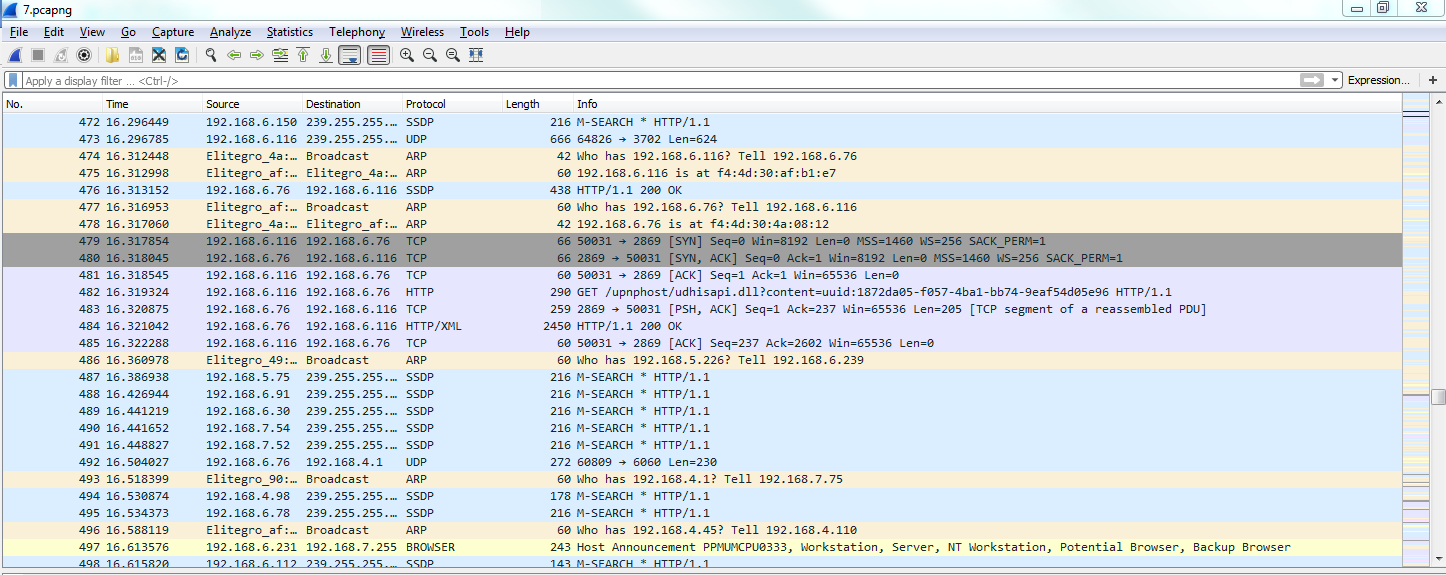
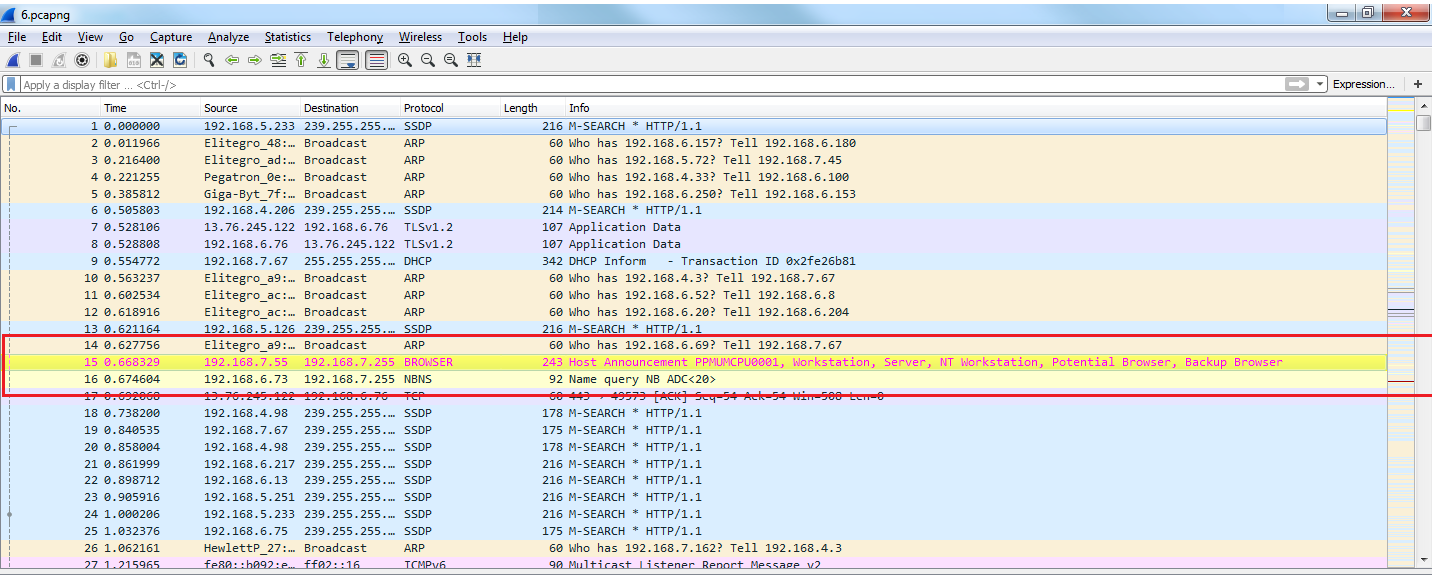
I pulled up one of the previous captures that I've done—loading up a web page. We'll use this as an example for our coloring rules discussion. You can see here that it's already been colorized by default from Wireshark:
As I mentioned before in the profiles in the Preferences section, there are default settings within Wireshark, which include the coloring rules. Wireshark tries to make it a little bit easier for you to view your traffic, even from just a standard install. But you can, of course, customize that to show what you want to see.
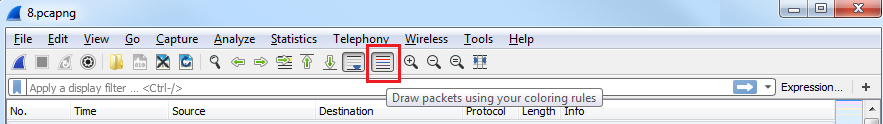
The first thing you want to know, besides the fact that Wireshark will automatically colorize your traffic and from a basic standpoint, is that you can enable and disable the rules with one button. Up at the top of the window, you can click on the Draw packets using your coloring rules button that looks like kind of a rainbow color of lines, and you can click on this to enable or disable the coloring rules in bulk:
If I click on this and disable, now everything turns to white and there are no coloring rules currently applied:
If you click on the Draw packets using your coloring rules button again, it will re-enable the coloring rules.
In order to get to the coloring rules, we'll go to View | Coloring Rules...:
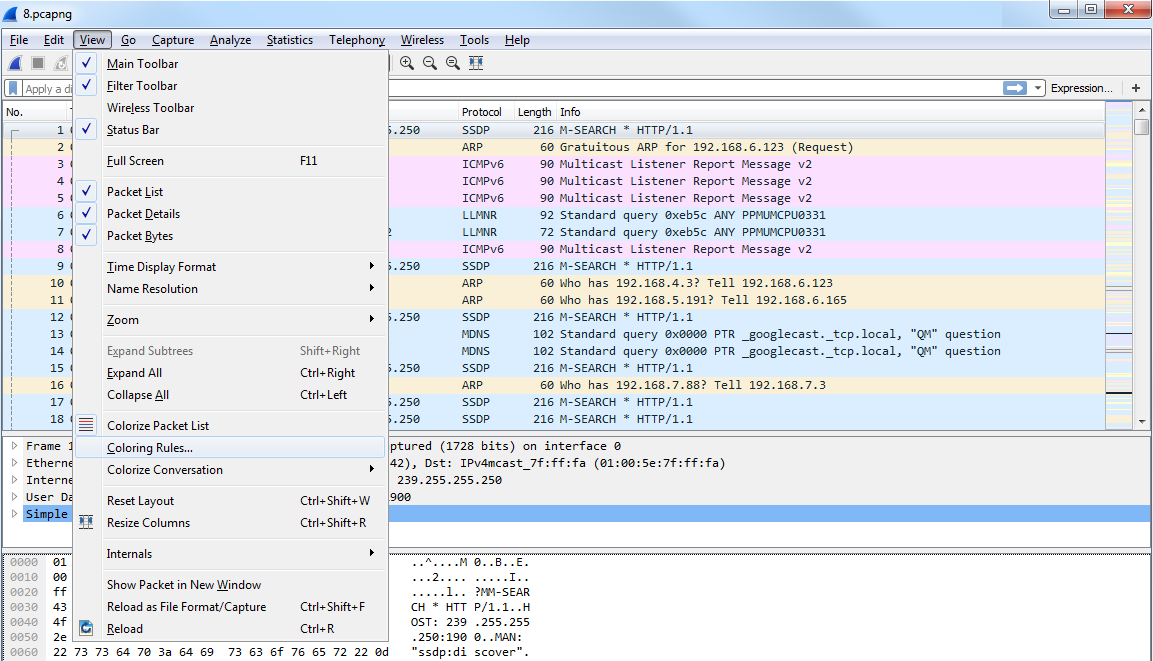
Clicking on the Coloring Rules... option will bring up the Coloring Rules window, and you can see that the default selection of coloring rules are created by Wireshark at installation:
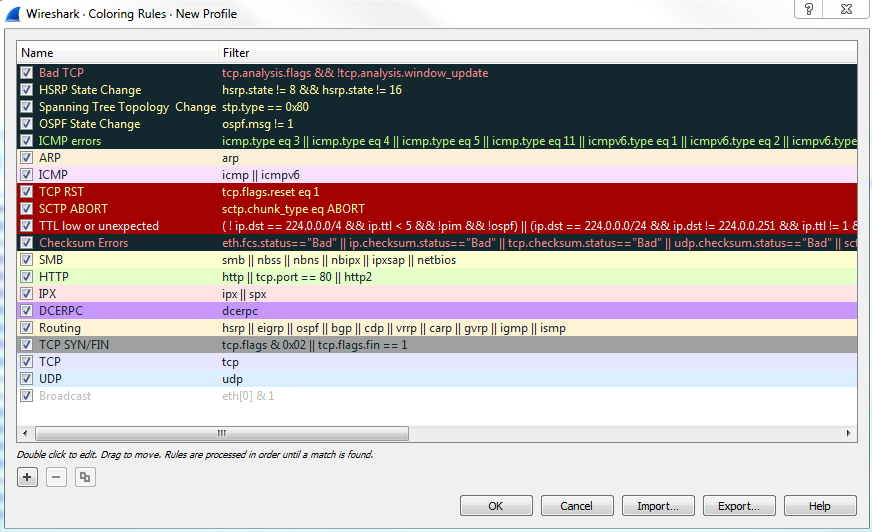
You can see how the default rules have some real vibrant coloring rules right at the very top. And these are some of the nasty ones that you want to keep an eye out for, and that's why they have a black background. That way, they stick out in this default pastel coloring system that they have for the other traffic. You can see most of the other normal stuff, such as ARP, ICMP, SMB, HTTP, and UDP; all of them are nice pastel-type colors. And then all of a sudden you have this black background show up with red text and you know that's obviously something bad. You have the yellow show up; you have the bright red with the TCP resets and the aborts; and you have Checksum Errors that are black with a red text. They're supposed to stand out on purpose. Another thing to know about this is that you see how the bad ones are up at the top: the rules are processed from top down, so it's based off of a matching system. If something matches first, then that will be applied. If you have two rules that are very similar and, maybe you have IC-two rules that look for ICMP but have different colors for some reason-the one at the top will be applied first and the one after it will be skipped as it has already been colorized.
Additionally, on the left-hand side of all these coloring rules are a bunch of checkboxes, and these checkboxes enable and disable these individual coloring rules. That way, you don't have to enable or disable all of them at once with that button I just showed you. Thus, you can simply turn off the checkboxes you want or don't want.
For example, what we can do is, we can turn off HTTP, which is this nice light green color you can see throughout all of our capture if you look at the scroll bar. All of our packets are green. So I'll turn HTTP off; we'll then click on OK. When I do this, you can see that they all turn into purple:
Now why do they turn into purple? Let's go back to View | Coloring Rules... and take a look. And if we check, the TCPs are light purple. So here, all the communication, all the packets, are TCP packets.
Remember I was talking about how things match first on this list towards the top? So, obviously, the HTTP traffic, which is more specific since that's a higher-level protocol, matched first and so was applied green. And then, when it matched for TCP it was ignored because it was already colorized. You can see how you want to put more specific things towards the top and then more generic things towards the bottom, and you can see how it's kind of broken out that way already with all these very specific filters up at the top and then the basic ones at the bottom, such as TCP and UDP.
You can also create your own, of course. In the bottom left, just like the other windows we've seen already, you can click on the plus sign that will create a new coloring rule. And you can see it puts it up towards the top for you, as well, which is very nice. Here, you can enter any sort of display filter you want to create a color. We could say ip.host is my gateway and we can choose a foreground and background color. You can see at the bottom that we can choose a Foreground and Background color:
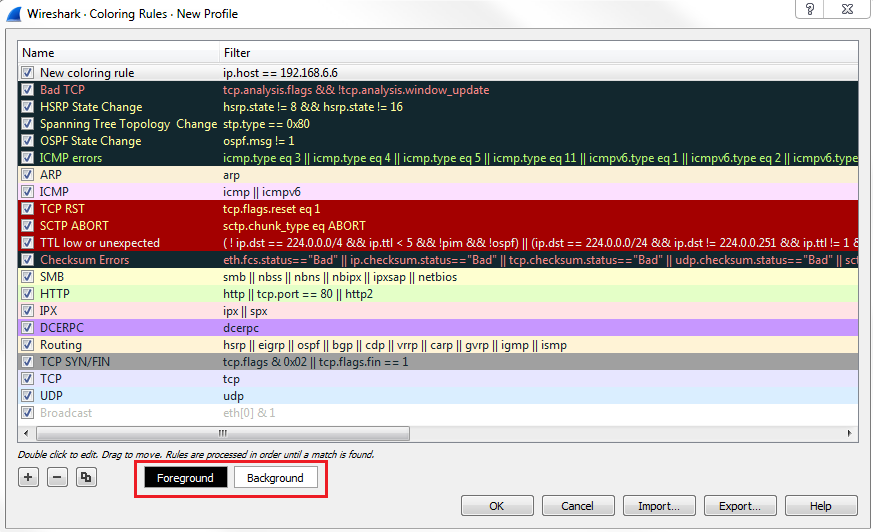
So, let's make it something completely ridiculous. The foreground will be bright pink and the background will be a hideous yellow color. Let's rename it first. We'll say Gateway, and click on OK. That definitely stands out, doesn't it? Check out the following screenshot:
Now you can see how all of the packets that reference my gateway are now colored in bright yellow.
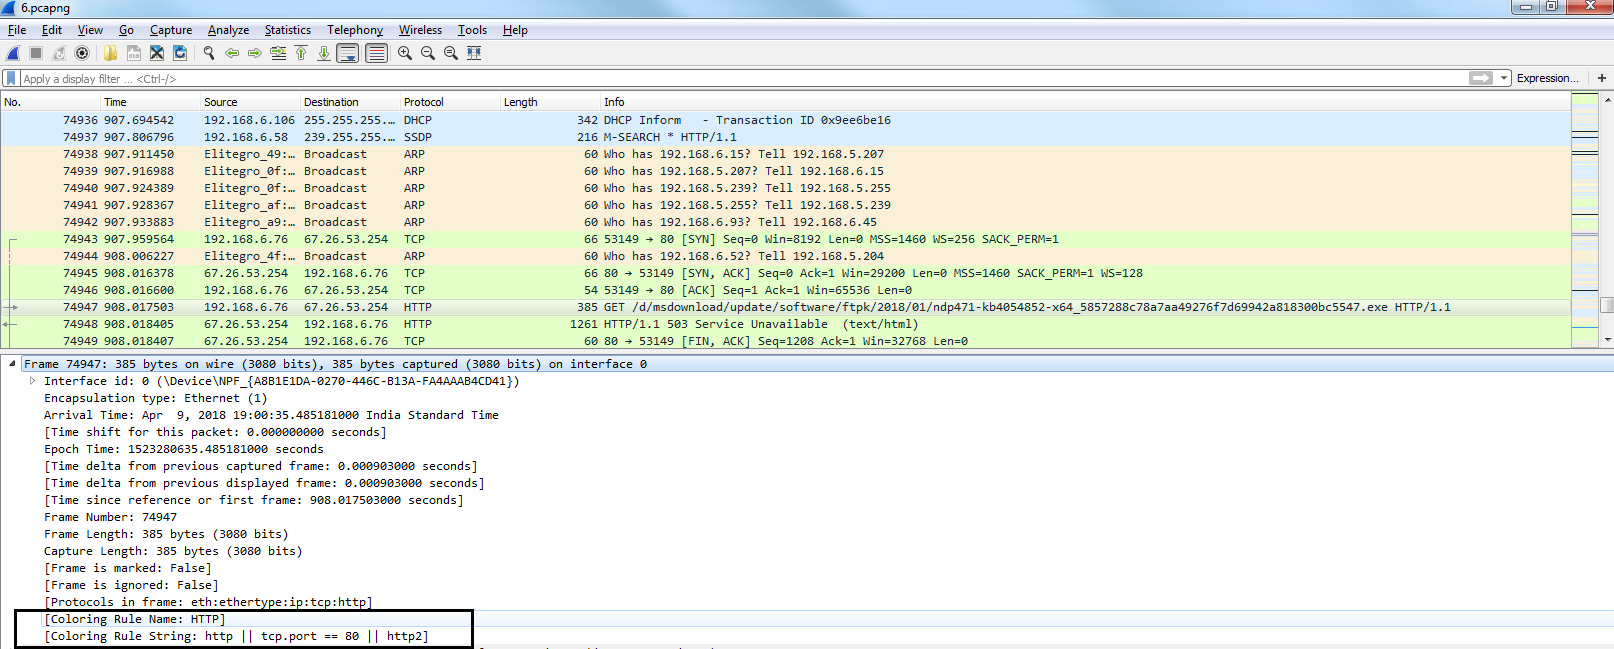
Until now, we were trying to figure out which coloring rule applies to a specific packet, and we were doing so by going to View | Coloring Rules... and trying to just figure it out by ourselves by going down the list. Now, you don't have to do it that way; there's an easier way of doing it.
If you click on a packet that you want to investigate and find out why is this green, we can look in the packet details and, under the Frame section we can go down towards the bottom of the frame information, and it will show us the coloring rules that are applied. So, the coloring rule name is HTTP, and the string that applies to our selected packet is http || tcp.port ==80 || http2:
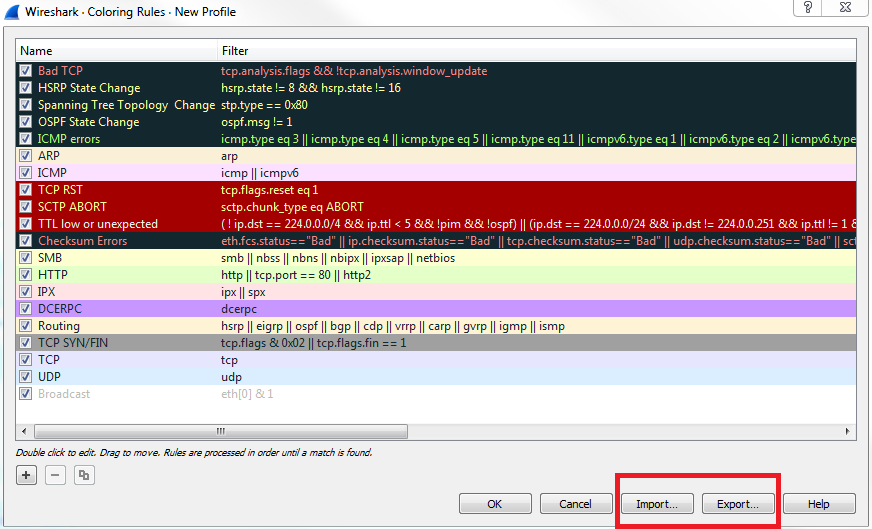
Now, if you make a whole bunch of custom coloring rules for your specific company in your certain situation that you have going on, you can absolutely import and export these to share them with co-workers. Let's go back to View | Coloring Rules..., and you can see in the bottom right of the window that we have Import... and Export... buttons, which will export it or import it as a text file:
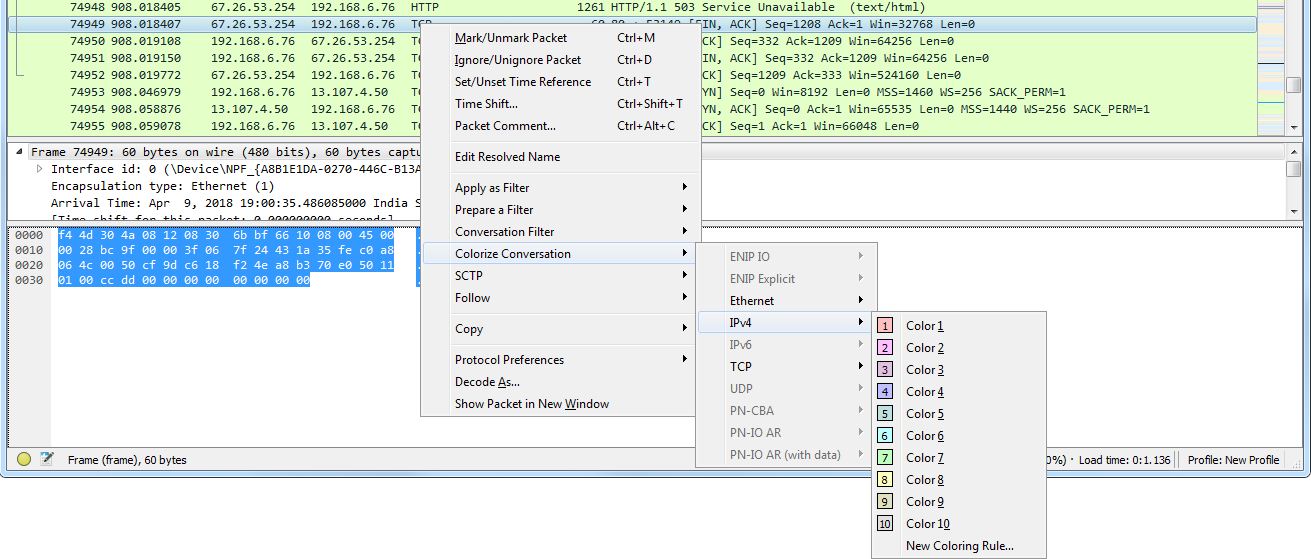
Additionally, we can colorize conversations. What we'll do is, we'll go and select a random packet in this conversation, and we can right-click on it and go to Colorize Conversation. And then we can break down on which conversation we want and which layer of the OSI model:
And finally, one cool feature I want to show you is you can go ahead and actually filter on the coloring rules. Let's select a packet, an HTTP packet, and we'll go into that frame section in the packet details again. And I'll right-click on the coloring rule that is applied to this packet and I can go to Apply as Filter | Selected:
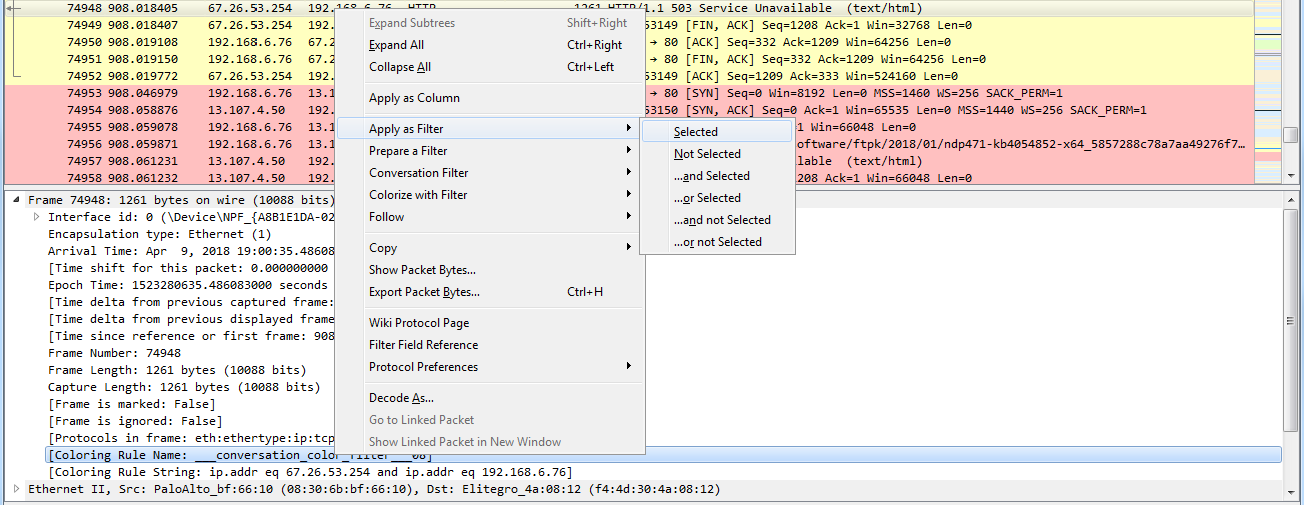
Now, I'm filtering on that coloring rule, so it's not just on the fact that it's HTTP traffic, but it's on the coloring rule applied.
So we can do that to another one as well. We'll go and right-click on the coloring rule that is applied to the selected packet, and we'll select Apply as Filter | Selected. And now we've just filtered out that conversation based on the coloring rule.