Table of Contents for
Your Code as a Crime Scene
 Your Code as a Crime Scene
Published by
Pragmatic Bookshelf, 2015
Your Code as a Crime Scene
Published by
Pragmatic Bookshelf, 2015
- Title Page
- Your Code as a Crime Scene
- Your Code as a Crime Scene
- For the Best Reading Experience...
- Table of Contents
- Early praise for Your Code as a Crime Scene
- Foreword by Michael Feathers
- Acknowledgments
- Chapter 1: Welcome!
- About This Book
- Optimize for Understanding
- How to Read This Book
- Toward a New Approach
- Get Your Investigative Tools
- Part 1: Evolving Software
- Chapter 2: Code as a Crime Scene
- Meet the Problems of Scale
- Get a Crash Course in Offender Profiling
- Profiling the Ripper
- Apply Geographical Offender Profiling to Code
- Learn from the Spatial Movement of Programmers
- Find Your Own Hotspots
- Chapter 3: Creating an Offender Profile
- Mining Evolutionary Data
- Automated Mining with Code Maat
- Add the Complexity Dimension
- Merge Complexity and Effort
- Limitations of the Hotspot Criteria
- Use Hotspots as a Guide
- Dig Deeper
- Chapter 4: Analyze Hotspots in Large-Scale Systems
- Analyze a Large Codebase
- Visualize Hotspots
- Explore the Visualization
- Study the Distribution of Hotspots
- Differentiate Between True Problems and False Positives
- Chapter 5: Judge Hotspots with the Power of Names
- Know the Cognitive Advantages of Good Names
- Investigate a Hotspot by Its Name
- Understand the Limitations of Heuristics
- Chapter 6: Calculate Complexity Trends from Your Code’s Shape
- Complexity by the Visual Shape of Programs
- Learn About the Negative Space in Code
- Analyze Complexity Trends in Hotspots
- Evaluate the Growth Patterns
- From Individual Hotspots to Architectures
- Part 2: Dissect Your Architecture
- Chapter 7: Treat Your Code As a Cooperative Witness
- Know How Your Brain Deceives You
- Learn the Modus Operandi of a Code Change
- Use Temporal Coupling to Reduce Bias
- Prepare to Analyze Temporal Coupling
- Chapter 8: Detect Architectural Decay
- Support Your Redesigns with Data
- Analyze Temporal Coupling
- Catch Architectural Decay
- React to Structural Trends
- Scale to System Architectures
- Chapter 9: Build a Safety Net for Your Architecture
- Know What’s in an Architecture
- Analyze the Evolution on a System Level
- Differentiate Between the Level of Tests
- Create a Safety Net for Your Automated Tests
- Know the Costs of Automation Gone Wrong
- Chapter 10: Use Beauty as a Guiding Principle
- Learn Why Attractiveness Matters
- Write Beautiful Code
- Avoid Surprises in Your Architecture
- Analyze Layered Architectures
- Find Surprising Change Patterns
- Expand Your Analyses
- Part 3: Master the Social Aspects of Code
- Chapter 11: Norms, Groups, and False Serial Killers
- Learn Why the Right People Don’t Speak Up
- Understand Pluralistic Ignorance
- Witness Groupthink in Action
- Discover Your Team’s Modus Operandi
- Mine Organizational Metrics from Code
- Chapter 12: Discover Organizational Metrics in Your Codebase
- Let’s Work in the Communication Business
- Find the Social Problems of Scale
- Measure Temporal Coupling over Organizational Boundaries
- Evaluate Communication Costs
- Take It Step by Step
- Chapter 13: Build a Knowledge Map of Your System
- Know Your Knowledge Distribution
- Grow Your Mental Maps
- Investigate Knowledge in the Scala Repository
- Visualize Knowledge Loss
- Get More Details with Code Churn
- Chapter 14: Dive Deeper with Code Churn
- Cure the Disease, Not the Symptoms
- Discover Your Process Loss from Code
- Investigate the Disposal Sites of Killers and Code
- Predict Defects
- Time to Move On
- Chapter 15: Toward the Future
- Let Your Questions Guide Your Analysis
- Take Other Approaches
- Let’s Look into the Future
- Write to Evolve
- Appendix 1: Refactoring Hotspots
- Refactor Guided by Names
- Bibliography
- You May Be Interested In…
Take Other Approaches
The techniques in this book are a starting point. There’s much more information in our code repositories. So before we leave, let’s look at some other approaches. What follows are strategies that might give you even more information. These ideas may also serve as an inspiration once you choose to explore our topic in more depth.
Investigate More Than Source Code
If you have other artifacts stored under version control, you can include them in the analyses as well. Some examples include documents, requirement specifications, or manuals for your product. Perhaps you’ll even look for temporal dependencies between your requirements and code.
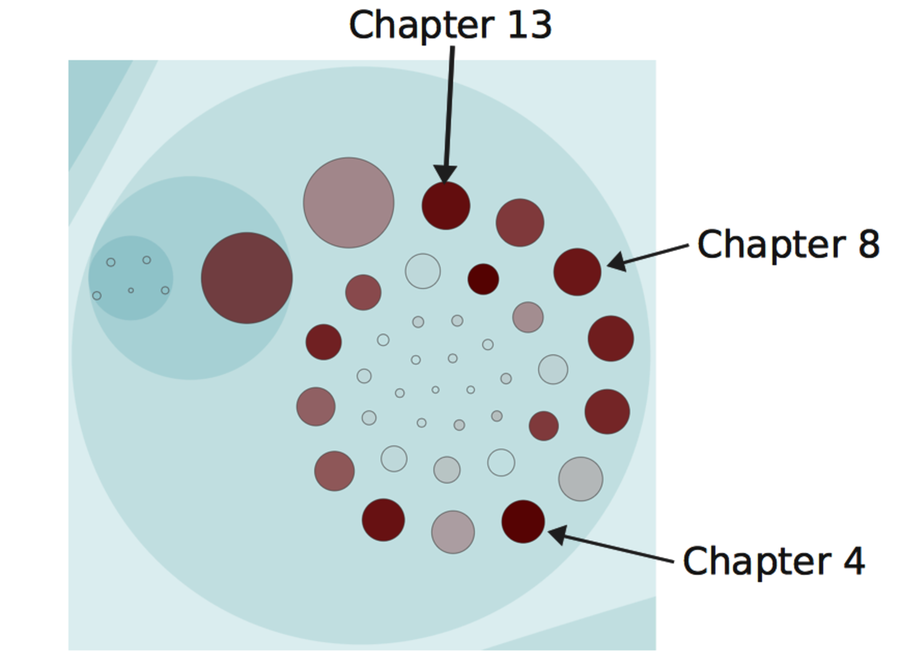
Have a look at the following figure as an example of a non-code analysis. This picture shows the hotspots in the book you’re reading right now. (If you’re looking to contribute to the errata, Chapter 13 seems like a chance to score big.)
Find Classes That Violate Design Principles
Our version-control systems record changes on a much more granular level than the file. This information is available to you through a simple diff between two revisions. The details that diff gives you let you reason about how the interior of a class evolves.
One of the more interesting approaches in this area is Michael Feathers’s[42] use of version-control data to ferret out violations of the Single Responsibility Principle. His technique uses the added, changed, and deleted lines of code to identify clusters of methods within a class. For example, you might find that some methods tend to change together within the same day. When you spot a trend, it might mean you’ve detected a responsibility that you can express in a new class.
Michael’s technique is basically a temporal coupling analysis between methods. The analysis is harder to implement because our tools need to be language-aware. The payoff is a tool that provides us with refactoring support based on what our code actually needs. (See Appendix 1, Refactoring Hotspots, for a heuristic based on the same idea.)
Analyze Your Developer Networks
Social factors play an important role in how our code evolves. We’ve talked about communication and knowledge distribution. Let’s take that a step further by analyzing developer networks.
The following figure shows the relationship between different programmers based on their interactions in code. All programmers are represented by nodes colored with their team affiliation. Each time we touch the same piece of code as another developer, we get a link between us. The more often we work with the same code, the stronger the link. This information allows us to detect social dependencies across team boundaries.
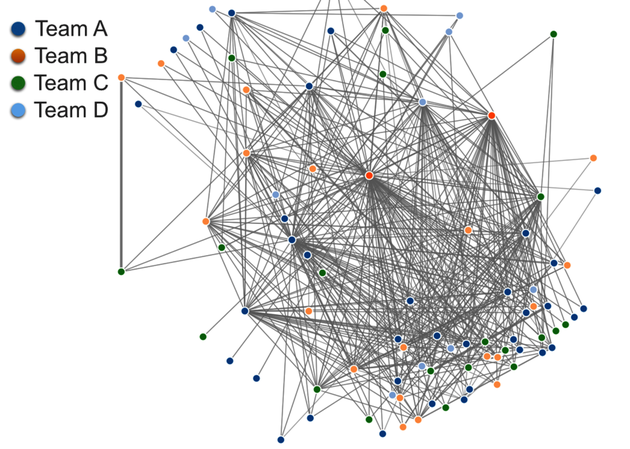
The network information is mined by Code Maat’s communication analysis. An interesting approach is to analyze the data as a graph to extract complex relationships we cannot spot in the visualization alone. For example, a graph lets us find all programmers that we depend on together with all the programmers they depend on themselves.
Remember Conway’s law—our designs work best when we align them with our organization. A developer network lets you evaluate your design from that perspective.
Craft Your Own Tools
So far we’ve discussed general analysis tools that we can apply to most codebases. Once you’ve gained experience and are comfortable with them, you’ll decide you need to run more analyses. You need to craft your own tools. The advantage of building custom tools is that you can tailor the analysis to specific content. Let’s look into that a bit.
The version-control analyses we’ve performed previously aren’t difficult from a mathematical point of view. The trickiest part—which wasn’t that difficult either—was to parse the input data into a format on which you can perform calculations. You can simplify a lot here. Version-control systems like Git support a tremendous number of options to tailor the log output. Use those options to derive a log format containing the minimum of what’s needed to answer the analysis questions you have.
Another tool-building approach is to leverage existing expertise. Moose[43] is an open-source platform for building custom analyses quickly. (You’ve already seen a piece of Moose work in Code City that we looked at in Chapter 2, Code as a Crime Scene.) Moose helps with tasks such as parsing, visualizations, and more. I recommend you check it out.
Customize Your Analyses for Pair Programming
Most of the analyses we’ve done ignore the author field in the commit info. However, in case you want to build a knowledge map or analyze parallel work between teams, you need that information. And it may be a little bit harder to obtain if you pair program. Let’s see what you can do.
When you pair program, you can identify the involved programmers through the commit message. Some pairs already put their initials at the start of the commit message. If you make that a practice, you have all the data you need. You just need to tailor your tools to pick that information instead of the author field in the log.