Table of Contents for
Your Code as a Crime Scene
 Your Code as a Crime Scene
Published by
Pragmatic Bookshelf, 2015
Your Code as a Crime Scene
Published by
Pragmatic Bookshelf, 2015
- Title Page
- Your Code as a Crime Scene
- Your Code as a Crime Scene
- For the Best Reading Experience...
- Table of Contents
- Early praise for Your Code as a Crime Scene
- Foreword by Michael Feathers
- Acknowledgments
- Chapter 1: Welcome!
- About This Book
- Optimize for Understanding
- How to Read This Book
- Toward a New Approach
- Get Your Investigative Tools
- Part 1: Evolving Software
- Chapter 2: Code as a Crime Scene
- Meet the Problems of Scale
- Get a Crash Course in Offender Profiling
- Profiling the Ripper
- Apply Geographical Offender Profiling to Code
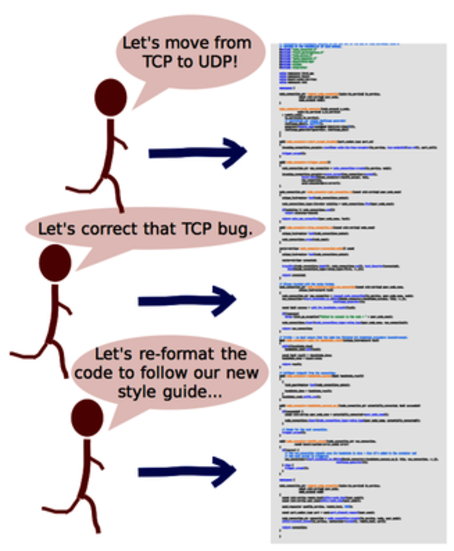
- Learn from the Spatial Movement of Programmers
- Find Your Own Hotspots
- Chapter 3: Creating an Offender Profile
- Mining Evolutionary Data
- Automated Mining with Code Maat
- Add the Complexity Dimension
- Merge Complexity and Effort
- Limitations of the Hotspot Criteria
- Use Hotspots as a Guide
- Dig Deeper
- Chapter 4: Analyze Hotspots in Large-Scale Systems
- Analyze a Large Codebase
- Visualize Hotspots
- Explore the Visualization
- Study the Distribution of Hotspots
- Differentiate Between True Problems and False Positives
- Chapter 5: Judge Hotspots with the Power of Names
- Know the Cognitive Advantages of Good Names
- Investigate a Hotspot by Its Name
- Understand the Limitations of Heuristics
- Chapter 6: Calculate Complexity Trends from Your Code’s Shape
- Complexity by the Visual Shape of Programs
- Learn About the Negative Space in Code
- Analyze Complexity Trends in Hotspots
- Evaluate the Growth Patterns
- From Individual Hotspots to Architectures
- Part 2: Dissect Your Architecture
- Chapter 7: Treat Your Code As a Cooperative Witness
- Know How Your Brain Deceives You
- Learn the Modus Operandi of a Code Change
- Use Temporal Coupling to Reduce Bias
- Prepare to Analyze Temporal Coupling
- Chapter 8: Detect Architectural Decay
- Support Your Redesigns with Data
- Analyze Temporal Coupling
- Catch Architectural Decay
- React to Structural Trends
- Scale to System Architectures
- Chapter 9: Build a Safety Net for Your Architecture
- Know What’s in an Architecture
- Analyze the Evolution on a System Level
- Differentiate Between the Level of Tests
- Create a Safety Net for Your Automated Tests
- Know the Costs of Automation Gone Wrong
- Chapter 10: Use Beauty as a Guiding Principle
- Learn Why Attractiveness Matters
- Write Beautiful Code
- Avoid Surprises in Your Architecture
- Analyze Layered Architectures
- Find Surprising Change Patterns
- Expand Your Analyses
- Part 3: Master the Social Aspects of Code
- Chapter 11: Norms, Groups, and False Serial Killers
- Learn Why the Right People Don’t Speak Up
- Understand Pluralistic Ignorance
- Witness Groupthink in Action
- Discover Your Team’s Modus Operandi
- Mine Organizational Metrics from Code
- Chapter 12: Discover Organizational Metrics in Your Codebase
- Let’s Work in the Communication Business
- Find the Social Problems of Scale
- Measure Temporal Coupling over Organizational Boundaries
- Evaluate Communication Costs
- Take It Step by Step
- Chapter 13: Build a Knowledge Map of Your System
- Know Your Knowledge Distribution
- Grow Your Mental Maps
- Investigate Knowledge in the Scala Repository
- Visualize Knowledge Loss
- Get More Details with Code Churn
- Chapter 14: Dive Deeper with Code Churn
- Cure the Disease, Not the Symptoms
- Discover Your Process Loss from Code
- Investigate the Disposal Sites of Killers and Code
- Predict Defects
- Time to Move On
- Chapter 15: Toward the Future
- Let Your Questions Guide Your Analysis
- Take Other Approaches
- Let’s Look into the Future
- Write to Evolve
- Appendix 1: Refactoring Hotspots
- Refactor Guided by Names
- Bibliography
- You May Be Interested In…
Find the Social Problems of Scale
In the first parts of this book, we discussed large codebases and how we fail to get a holistic view of them. We just can’t keep it all in a single brain. We recognize when we suffer from quality problems or when the work takes longer than we’d expect it to, but we don’t know why.
The reasons go beyond technical difficulties and include an organizational component as well. On many projects, the organizational aspects alone determine success or failure. Let’s understand them better.
Know the Difference Between Open-Source and Proprietary Software
So far we’ve used real-world examples for all our analyses. The problems we’ve uncovered are all genuine. But when it comes to the people side, it gets harder to rely on open-source examples because the projects don’t have a traditional corporate organization.
Open-source projects are self-selected communities, which creates different motivational forces for the developers. In addition, open-source projects tend to have relatively flat and simple communication models. As a result, research on the subject has found that Brooks’s law doesn’t hold up as well: the more developers involved in an open-source project, the more likely that the project will succeed (source: Brooks’ versus Linus’ law: an empirical test of open source projects [SEKH09]).
However, there are other aspects to consider. In a study on Linux, researchers found that “many developers changing code may have a detrimental effect on the system’s security” (source: Secure open source collaboration: an empirical study of Linus’ law [MW09]). More specifically, with more than nine developers, the modules are sixteen times more likely to contain security flaws. The result just means that open source cannot evade human nature; we pay a price for parallel development in that setting, too.
Anyway, we’ll need to pretend a little in the following case studies. We need to pretend that the open-source projects are developed by a traditional organization. The intent is to show you how the analyses work so that you can use them on your own systems. Proprietary or not, the analyses are the same, but the conclusions may vary. With that in mind, let’s get started!
Understand How Hotspots Attract Multiple Authors
Adding more people to a project isn’t necessarily bad as long as we can divide our work in a meaningful way. The problems start when our architecture fails to sustain all developers.
We touched on the problem as we investigated hotspots. Hotspots frequently arise from code that accumulates responsibilities. That means programmers working on independent features are forced into the same part of the code. (Hotspots are the traffic jams of the software world.)
When multiple programmers make changes in parallel to the same piece of code, things often go wrong. We risk conflicting changes and inconsistencies, and we fail to build mental models of the volatile code.
If we want to work effectively on a larger scale, we need to ensure a certain isolation. Here’s how you find that information.
Analyze Your Code for Multiple Authors
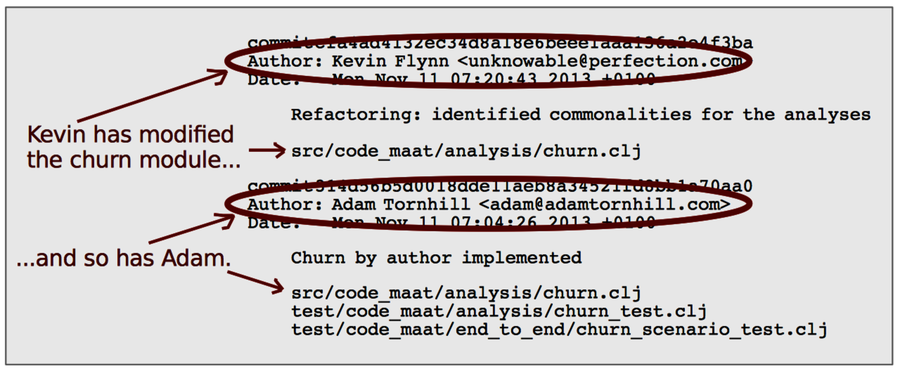
As you can see in the following figure, each commit contains information about the programmer who made the change. Just as we calculated modification frequencies to determine hotspots, let’s now calculate author frequencies of our modules.
In this case study, we’ll move back to Hibernate because the project has many active contributors. You can reuse your hib_evo.log log file if you still have it. Otherwise, just create a new one, as we did back in Generate a Version-Control Log.
Use the authors analysis to discover the modules that are shared between multiple programmers:
| | prompt> maat -l hib_evo.log -c git -a authors |
| | entity,n-authors,n-revs |
| | ../persister/entity/AbstractEntityPersister.java,14,44 |
| | libraries.gradle,11,28 |
| | ../internal/SessionImpl.java,10,39 |
| | ../loader/Loader.java,10,23 |
| | ../mapping/Table.java,9,28 |
| | ... |
The results show all modules in Hibernate, sorted by their number of authors. The interesting information is in the n-authors column, which shows the number of programmers who have committed changes to the module.
As you see, the AbstractEntityPersister.java class is shared between fourteen different authors. That may be a problem. Let’s see why.
Learn the Value of Organizational Metrics
In an impressive research effort, a team of researchers investigated one of the largest pieces of software ever written: Windows Vista. The project was investigated for the links between product quality and organizational structure. (Read about the research in The Influence of Organizational Structure on Software Quality [NMB08].) The researchers found that organizational metrics outperform traditional measures, such as code complexity or code coverage. In fact, the organizational structure of the programmers that create the software is a better predictor of defects than any property of the code itself!
One of these super-metrics was the number of programmers who worked on each component. The more parallel work, the more defects in that code. This is similar to the analysis you just performed on Hibernate. Let’s dig deeper.